
Interest Coverage Ratio Explained
Imagine someone earning ₹1 lakh a month.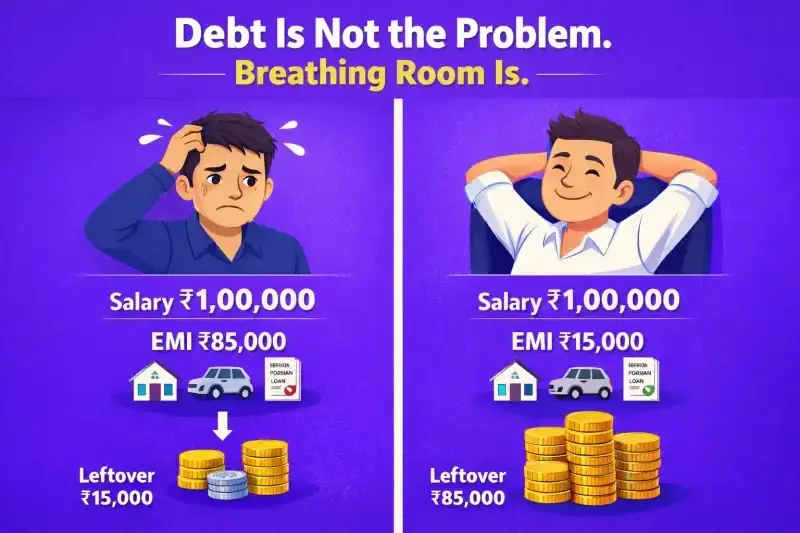
Now imagine, out of that ₹1 lakh, about ₹80,000–₹85,000 goes straight into EMIs — home loan, car loan, maybe a personal loan as well. Technically, the person is paying all their bills. Nothing has defaulted. At first, everything looks perfectly normal.
Then again, if you really think about it, these are actually very precarious circumstances - it wouldn’t take too much to throw these individuals into upheaval should something unforeseen, such as either an unexpected financial problem, a missed payment, or a loss of income, were to occur.
Consider another example of an individual earning the same, ₹1 lakh, but only being required to pay ₹15,000 as EMIs.
They also have debt. They’re also paying interest on their loans. But their situation feels very different. While something might go wrong for a couple of months, they still have enough room to deal with the situation.
Both people have loans, and both people are paying off the interest.
However, there are clear differences in the breathing room they each have.
Businesses are much the same as people, as they tend to borrow money to expand, whether this means creating a factory, opening a new facility, investing in technology, etc. And once they borrow, interest payments become a regular obligation.
For investors, the real question is not simply whether a company has taken on debt.
The more important question is:
Is the company earning enough to comfortably pay the interest on that debt?
This is where the Interest Coverage Ratio becomes useful.
Understanding the Interest Coverage Ratio in Simple Terms
After understanding the situation above, the next step is to quantify it. Investors need a simple way to judge whether a company is comfortably handling its interest obligations or merely managing to stay afloat.
This is exactly what the Interest Coverage Ratio helps measure.
The Interest Coverage Ratio indicates how frequently a company's profits can pay down interest on its debt. More importantly than just asking whether the business will meet its obligations this financial year, the ratio provides insight into how much "wiggle room" exists for the company's ability to make its future payments.
The idea is fairly straightforward. A company generates operating profit from its business. Out of that profit, it must set aside a portion to pay interest on the loans it has taken. If the company’s profits are many times larger than the interest it needs to pay, the situation is generally safe. However, when the profits are merely marginally larger than the interest expenses, very limited leeway is available.
Calculating the Interest Coverage Ratio is done using the very simple formula outlined below:
Interest Coverage Ratio = EBIT ÷ Interest Expense
Here, EBIT refers to Earnings Before Interest and Taxes. In other words, it is the profit earned by the company from its business operations before making any provisions for interest or taxes.
The next part of the equation is the interest expenses, which are the total interest expenses that need to be paid by the company in that year.
Dividing the Company's Operating Profit by its Interest Expense is used to determine the level of efficiency of the Company in handling its Interest Expense.
For example, if the Operating Profit of a Company is ₹500 Crore and its Interest Expense is ₹100 Crore, then the ratio becomes 5:1. Then, in this case, the Interest Coverage Ratio of the company will be 5x.
This simply means the company’s operating profit is five times larger than the interest it needs to pay. With that kind of cushion, the company should be able to meet its interest obligations without much difficulty.
However, if the ratio is close to 1, it suggests that most of the company’s operating profit is being used just to cover interest payments. In such a situation, even a small drop in profits could make servicing the debt more challenging.
Once we know how to calculate the Interest Coverage Ratio, the next question is very simple indeed: what does it all mean?
What the Interest Coverage Ratio Actually Tells Investors
At its most basic level, all it really says is how easily we can pay off the interest on our debt with the profits of our business.“The essence of investment management is the management of risks, not the management of returns.”- Benjamin Graham
A higher figure usually means a bigger safety margin is in place. The company’s operating profits are considerably higher than its interest expenses, and this means it should be able to pay its debt obligations even if business conditions are difficult for a period of time.
If the figure is low, it means a significant part of the company’s profits is already going towards paying its interest expenses. In such cases, even a small reduction in profits can start affecting the company’s financials.
Investors assess the following ranges when interpreting the ratio -
If the ratio is less than 1.0, the firm does not produce enough operating income to cover interest costs. This creates concern about the ability of the firm to repay the debt because it would likely need to withdraw from its reserves and/or incur additional debt and/or sell assets in order to do so.
An investment-grade company falls in the range of 1.0 - 2.0; that is, the company can pay its interest expense from its operational cash flow, but there is very little buffer or margin for error. Any unexpected decline in profits could make things uncomfortable.
A ratio in the range of 2 to 4 generally indicates a more stable position. The company has a reasonable buffer between its profits and its interest payments.
When the ratio rises above 5, it typically signals a strong ability to service debt. In such cases, the company’s operating profits are several times larger than its interest expenses, giving it plenty of breathing room.
That said, the ratio should always be viewed in the context of the industry. Businesses in capital-intensive sectors such as infrastructure, telecom, or airlines tend to operate with higher levels of debt, so their interest coverage ratios may naturally be lower than those of asset-light companies.
For this reason, investors rarely rely on the ratio in isolation. It becomes far more useful when it is tracked over time and compared with other companies in the same industry.
Why Industry Context Matters When Looking at This Ratio
Another thing worth bearing in mind is that the Interest Coverage Ratio is not really in a vacuum; it is always dependent on the kind of industry in which the company is operating.
Some industries are just more capital-intensive in the way they are operated and conducted. For example, in industries like steel, cement, power, airlines, and infrastructure, huge factories and plants are needed just to start and continue operating the business. Building and maintaining all of this requires a lot of capital, and a significant amount of this capital is usually debt.
Read More: What is a Capital-Intensive Business? Risks and How to Analyze Them.
As a result, more debt means more interest expenses, and this will, in turn, reduce the company’s Interest Coverage Ratio.
On the flip side, there are industries where capital requirements are far less intense in the way they are operated and conducted. For example, in industries like software services and consulting, capital is far less of an issue since they require far less in the way of factories and plants. Because of this, they usually operate with far less debt, and their interest expenses tend to be relatively small.
A quick comparison within the Tata Group itself makes this difference quite clear.
Even within the same business group, the numbers can look very different. For instance, TCS reports an Interest Coverage Ratio of around 58.24, while Tata Steel’s ratio is closer to 3.02.
The difference doesn’t necessarily mean one company is doing something wrong. It mainly reflects the nature of the businesses they operate in. TCS is a software services company that doesn’t require heavy physical infrastructure, whereas steel manufacturing involves massive investments in plants, machinery, and raw materials, which often leads to higher borrowing and interest costs. But the figures do not necessarily reflect on the management abilities of the two companies. Rather, the figures are a result of the stark contrasts in the industries in which the two companies are operating.
That is the reason why investors do not generally consider the figures in isolation. Interest Coverage Ratios can vary quite a bit from one industry to another. Because of this, comparing the ratio of a software company with that of a steel manufacturer or an airline may not really tell investors much.
A more useful approach is to compare a company’s Interest Coverage Ratio with other businesses operating in the same industry. This makes it easier to judge whether the company’s debt obligations are manageable relative to its peers.
Understanding how the ratio varies across industries is helpful, but it still leaves an important question for investors — why does this metric deserve attention in the first place?
The answer lies in what the ratio quietly reveals about a company’s financial stability.
Why Investors Pay Attention to the Interest Coverage Ratio
For investors, the Interest Coverage Ratio acts as a quick way to gauge how much financial pressure a company might be carrying.
Debt, by itself, isn’t necessarily a sign of trouble. Companies often use borrowing as a tool to grow their business — to expand operations, add new capacity, or finance projects that require large upfront investments. The issue arises when those borrowings start becoming difficult to manage.
For more understanding, read our article What is Debt to Equity Ratio? Why it Matters for Small Cap Investing.
This is where the Interest Coverage Ratio becomes useful. It gives investors a sense of how comfortably the company can meet its interest obligations using the profits generated from its business.
A company with a healthy ratio usually has enough operating profit left even after paying interest. This financial cushion becomes particularly valuable during difficult periods — for example, when demand weakens, costs rise, or profits temporarily decline.
“Only when the tide goes out do you discover who’s been swimming naked.”- Warren Buffett
On the other hand, when the ratio is very low, a large portion of the company’s profits is already committed to servicing debt. In such situations, even a modest drop in earnings can start putting pressure on the company’s finances.
Investors also tend to watch this ratio closely because it can sometimes hint at trouble before it becomes obvious elsewhere in the financial statements. If the Interest Coverage Ratio keeps falling over several years, it may be a sign that the company’s interest burden is starting to grow faster than its profits. That could mean the business is taking on more debt, or that its earnings are no longer growing the way they once were.
Because of this, the ratio often becomes one of the indicators investors look at when trying to understand the overall financial health of a company before making an investment decision.
A Quick Example from the Cement Industry
“Risk means more things can happen than will happen.”- Howard Marks
The cement industry is a useful place to see why the Interest Coverage Ratio matters so much in capital-intensive businesses. Running a cement company is an expensive undertaking. It requires building large manufacturing plants, securing limestone mines, and operating heavy industrial equipment. Because all of this demands substantial upfront investment, companies in this sector often rely on borrowing when they expand their capacity.
If we take two companies from the industry — UltraTech Cement and Sanghi Industries — their Interest Coverage Ratios tell very different stories.
UltraTech Cement reports an Interest Coverage Ratio of around 6.48. In simple terms, this means the company’s operating profits are more than six times the amount it needs to pay as interest. For investors, that usually suggests a fairly comfortable position. Even if business conditions become a little challenging for a while, the company would still have enough earnings to meet its interest obligations.
Sanghi Industries presents a very different situation. The company reports an Interest Coverage Ratio of roughly -1.07, which generally indicates that its operating earnings are not sufficient to cover the interest it owes. When this happens, the company may have to rely on other sources of funds — such as additional borrowing or asset sales — simply to keep up with its debt commitments.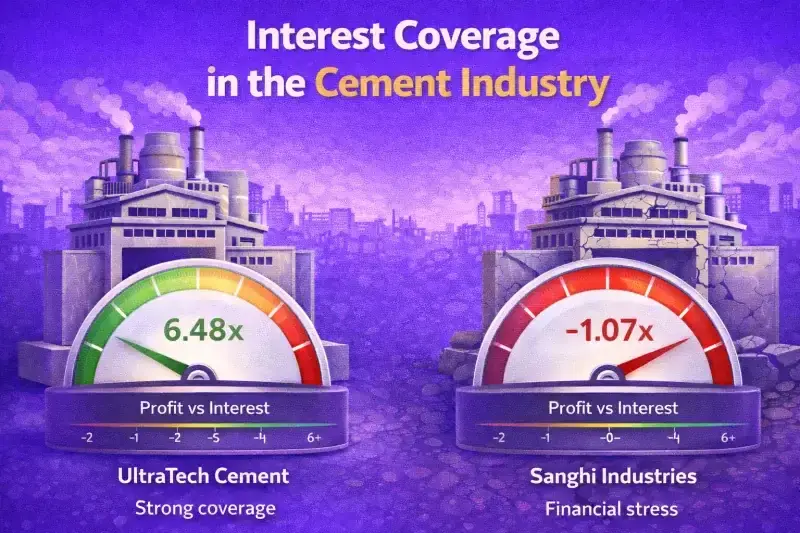
From an investor’s perspective, this difference matters. When a company has strong interest coverage, it usually means there is a comfortable buffer between its earnings and its interest payments. On the other hand, weak or negative coverage can signal that the company may struggle to handle its debt if business conditions deteriorate.
This is why investors often look at the Interest Coverage Ratio when comparing companies within the same industry — it helps them judge how comfortably each business is managing its debt.
Read More: What is Debt to Equity Ratio? Why it Matters for Small Cap Investing
The examples above show why the Interest Coverage Ratio can be helpful when looking at a company’s debt position. At the same time, it’s worth remembering that no single number can fully capture a company’s financial strength. The ratio provides a useful signal, but it doesn’t tell the entire story.
Limitations of the Interest Coverage Ratio
“Smart investing is about knowing what you don’t know.”- Charlie Munger
1. It focuses only on interest payments
The Interest Coverage Ratio looks at whether a company’s earnings are enough to pay the interest on its borrowings. What it doesn’t show is the repayment of the actual loan itself. A business might manage its interest obligations without much difficulty, yet still face pressure later when large portions of the debt need to be repaid.
2. It is based on accounting profits
The ratio uses operating profit from the company’s financial statements. However, accounting profits don’t always reflect the cash that is actually available to the business. There are situations where a company appears profitable in its accounts but still struggles with limited cash flows.
To understand more, read: How to Read a Balance Sheet Like a Professional Investor.
3. It can change with business cycles
In industries that move with economic cycles, profitability can fluctuate significantly. During periods of strong demand, companies may report higher earnings, which improves their Interest Coverage Ratio. But when the cycle turns, and profits decline, the ratio can fall just as quickly — even if the company’s debt levels haven’t changed.
4. It works best when combined with other metrics
However, the interest coverage ratio alone can only provide part of the information that is required. In general, investors tend to consider the interest coverage ratio in combination with other ratios, such as leverage ratios and profitability ratios. This will provide a better picture of the situation.
Read More: Understanding the Cash Flow Statement: Operating, Investing, Financing Activities
Explore our Products
Research Framework

Emerging Titans
Combination of quantitative analysis, industry tailwinds, and management assessment - SPRINT investment philosophy

Tiny Titans
Heavy emphasis on scuttlebutt research, plant visits, and early on-ground signals
Conclusion
The Interest Coverage Ratio helps answer a very simple but important question — how comfortably can a company pay the interest on its debt? A company may carry significant borrowings, but if its operating profits are strong enough to cover those interest payments several times over, the financial risk is often manageable. On the other hand, when earnings barely cover interest expenses, even a small decline in profits can start putting pressure on the business.
“The four most dangerous words in investing are: ‘This time it’s different.’” - John Templeton
This is why investors pay close attention to the ratio when evaluating companies, especially in capital-intensive industries. It offers a quick way to understand whether a company has a healthy financial cushion or whether its debt obligations could become difficult to manage during tougher periods. However, like most financial metrics, the Interest Coverage Ratio is most useful when it is examined alongside other indicators such as profitability, leverage, and cash flow.
Understanding ratios like these is an important step toward making better investment decisions. If this article helped simplify the concept for you, comment the word “COVERAGE” below, and let us know which financial ratio you would like us to break down next.
FAQ’s
What does the Interest Coverage Ratio measure?
+The Interest Coverage Ratio measures how easily a company can pay the interest on its debt using the profits generated from its operations. It shows how many times a company’s operating profit can cover its interest expenses.
How is the Interest Coverage Ratio calculated?
+The ratio is calculated using the formula:
Interest Coverage Ratio = EBIT ÷ Interest Expense
Where EBIT represents earnings before interest and taxes, and interest expense refers to the total interest payments a company must make on its debt.
What is considered a good Interest Coverage Ratio?
+In general, a ratio above 5 is considered strong, as it indicates that the company’s profits comfortably cover its interest payments. Ratios between 2 and 4 are usually viewed as stable, while ratios below 1 may signal financial stress.
Why does the Interest Coverage Ratio vary across industries?
+Some industries require far larger capital investments than others. Businesses in sectors like cement, steel, power, and airlines often rely more heavily on borrowing, which can result in lower Interest Coverage Ratios compared to asset-light industries like software or consulting.
What does a negative Interest Coverage Ratio mean?
+A negative Interest Coverage Ratio usually indicates that the company is not generating enough operating profit to cover its interest expenses. This can be a warning sign of financial stress.
Should investors rely only on the Interest Coverage Ratio?
+No. While the ratio provides useful insight into a company’s ability to service its debt, it should be analyzed alongside other metrics such as leverage ratios, profitability, and cash flow to gain a more complete understanding of a company’s financial health.

High growth stock specialist, Value Educator
Shashank Mahajan is an equity research professional with over 12 years of experience in identifying high-potential SME and micro-cap stocks at an early stage. He follows a rigorous scuttlebutt research–driven approach, combining on-ground insights with deep financial analysis. Shashank specializes in uncovering under-researched and under-owned companies with strong management quality and long-term growth potential. Through disciplined research and early identification, he focuses on spotting tomorrow’s market leaders before they enter the mainstream investor radar.

Glenmark: The USD 700 Mn Cancer Deal and Its Brands

Pharma Stocks in India 2026: Generics, APIs and CDMOs
Granules India: From Paracetamol to a 65% Gross Margin

Natco Pharma: After Revlimid, 29 Patent Challenges

Shilpa Medicare: Cancer APIs, Films and Biosimilars

Alembic Pharma: US Plants Pay Back, Margin Hits 22.2%
Explore our Products
Research Framework
Emerging Titans
Combination of quantitative analysis, industry tailwinds, and management assessment - SPRINT investment philosophy
Tiny Titans
Heavy emphasis on scuttlebutt research, plant visits, and early on-ground signals



Modern Warfare to Multibaggers
Key Trends. Strategic Shifts. Opportunities Ahead.
Today at 7:00 PM IST. Room opens 30 minutes before.
Don't Miss This Exclusive Webinar!
Join Value Educator to decode the key trends shaping India's defence sector and learn how to identify tomorrow's potential leaders in the space.
- In-depth research on India's defence sector
- Live Q&A session
- Actionable takeaways for long-term investors

 Orders
 Subscription
 Share with friends


Required Details
₹23999.00
(12 month subscription)
As per SEBI regulations, all users are mandated to complete the KYC that is validated for 1 year. Post payment, you will be redirected to the KYC screen


No comments yet. Be the first to comment!