
Debt to Equity Ratio Explained


In truth, for a considerable period of time, all seemed well. There was growth, the company was growing, and the story was quite interesting. What didn’t get much attention was how this growth was being funded. Borrowings kept increasing quietly in the background.
When the company finally stopped flying, the shock felt sudden to investors. But the financial pressure had been building for years. The risk wasn’t hidden in the headlines—it was sitting quietly on the balance sheet.
As the saying goes, “Debt is easy to take on when times are good, but hard to live with when times change.”
Such situations remind investors that financial strength goes beyond headlines and profits. It also depends on how responsibly a company manages its borrowings.
Kingfisher’s story shows that growth can look exciting on the outside, but hidden risks on the balance sheet can quietly build up.
To understand why, let’s begin with a description of the fundamentals of debt, equity, and the Debt-to-Equity Ratio that, collectively, demonstrate in what manner a firm actually finances its business.
Introduction: Debt, Equity, and the Debt-to-Equity Ratio
How does financial risk quietly build up in a business before things fall apart?
Want to understand the basics first? Link: Read our Beginner’s Guide to the Indian Stock Market.
To answer that, investors need to look beyond profits and growth numbers. What often matters more is how a company funds its operations and expansion. This is where debt, equity, and the Debt-to-Equity (D/E) ratio come into the picture.
At a basic level, every business runs on two sources of money:
- Debt — borrowed funds that come with fixed interest and repayment commitments.
- Equity — shareholders’ money, which doesn’t need repayment but absorbs losses first
As Benjamin Graham once said:
“Investment is about managing risk, not chasing returns.”
The Debt-to-Equity ratio helps capture this risk in a simple way by comparing borrowed money to owners’ funds:
D/E = Total Debt ÷ Shareholders’ Equity
A quick example makes this clearer:
- Company A: Equity ₹100, Debt ₹50 → D/E = 0.5
- Company B: Equity ₹100, Debt ₹200 → D/E = 2

When business conditions are favourable, both companies may appear healthy, and the more leveraged company might even grow faster.
But when profits slow or costs rise, the difference becomes obvious. Lower debt offers flexibility, while higher debt increases pressure.
As Howard Marks puts it:
“Leverage works both ways.”
The D/E ratio doesn’t decide whether a company is good or bad. Instead, it acts as an early warning signal, helping investors spot financial stress before it shows up in headline numbers.
Brush up on key stock terms here: Link: 10 Stock Market Terms Every Beginner Must Know Before Investing
To truly understand why companies still take on debt despite these risks—and how they balance it against equity—we now need to look at sources of funds and the role of WACC.
Why Companies Often Prefer Debt over Equity or Internal Accruals?
Behind every growth story, there's usually a very simple question that investors don't often pay attention to: where did the money come from?Every company requires funds to expand, to increase operations, creating investments in newer assets, or entering into new market, which ensures the smooth running of a business.
Broadly, companies rely on three major sources of funds.
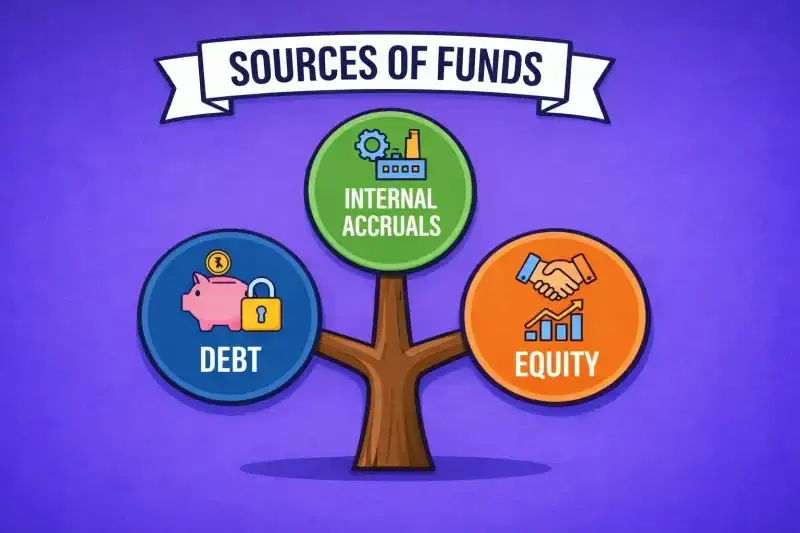
- money earned from their own business (Internal Accruals)
- money raised from shareholders (Equity)
- money borrowed from outside sources. (Debt)
Internal accruals: The first source is internal accruals. This refers to profits generated by the business and reinvested back into operations. Since this money comes from within, there are no interest payments, no repayment pressure, and no dilution of ownership. It is the safest and most comfortable form of funding. However, for many growing businesses, especially smaller ones, internal profits are often not sufficient to fund expansion at the pace required.
Equity: The second source is equity. Companies can raise funds for equity by issuing stocks to investors. This means long-term capital without any repayment liability for the raised funds. Equity can absorb losses and gives the business more flexibility during difficult periods. But it should be noted that it is not free money. There will be dilution of ownership, and long-term returns will be high.
Debt: The third source is debt. Debt involves borrowing money that must be repaid along with interest. Companies often prefer debt because it allows them to grow without giving up ownership. Interest costs are usually lower than the returns expected by equity investors, and interest payments are tax-deductible, which further reduces the effective cost. This makes debt appear attractive, especially when a company expects stable and timely cash flows.
When deciding how to fund growth, companies do not look at these options in isolation. They take in consideration the total cost of capital, which is also known as the Weighted Average Cost of Capital or WACC.
In simpler terms, WACC is the cost incurred by the firm for the funds it raises. It includes the cost of both debt and equity.

This means that a lower cost of capital helps to ensure a certain business can undertake investments and compete effectively. It's for this reason that several firms opt to source funds from two sources instead of relying on one.
This trade-off between lower cost and fixed obligations is why investors must pay close attention to how much debt a company carries.
This is where the debt and equity balance come into play. Knowing how much debt is raised against how much equity from shareholders helps investors understand whether funds for growth are being raised conservatively or aggressively. This balance between borrowed money and owner capital is exactly what the Debt-to-Equity ratio helps investors monitor.
We’ve seen how companies fund growth, how debt can amplify returns, and how too much leverage can create risk. But theory comes alive only when we look at a real-world example — and for that, Jet Airways provides a striking lesson.
“A Real-World Lesson in Leverage: Jet Airways”
The popularity of Jet Airways made it a popular choice in India. The planes were completely booked with passengers, and there were lots of investors excited about Jet on the stock market. However, the unfortunate downside to Jet Airways was the large amount of debt they were carrying that ultimately caused them to go bankrupt.Phase 1: Background & History
The company was formed in April 1993 by Naresh Goyal, with an aim to offer a new and customer-centric experience in aviation. At first, it started with its operations in the form of an air taxi service. However, its plan is to compete in the full-service carriers segment with the existing government-run carriers.
Initially, in 1995, “Jet Airways started domestic operations with scheduled flights linking major Indian cities based on providing superior service and punctuality.” This is because it was successful in creating customer loyalty and buyer brand preferences when it came to domestic airlines in the Indian market.
In 2004, Jet Airways began to establish its first international route network connecting Indian cities with locations throughout Europe, Asia, and the Middle East.
The subsequent year, Jet Airways launched an IPO (initial public offering) on the stock market, thus transitioning from a private to a publicly traded entity in order to increase its funding base. However, this is the period when the airline company diversified its fleet size by covering a substantial part of the domestic market.
Jet Airways operated a considerable volume of flights daily (hundreds) at the end of the decade. Jet Airways had produced a strong presence in India, where it was widely regarded as an elite airline.
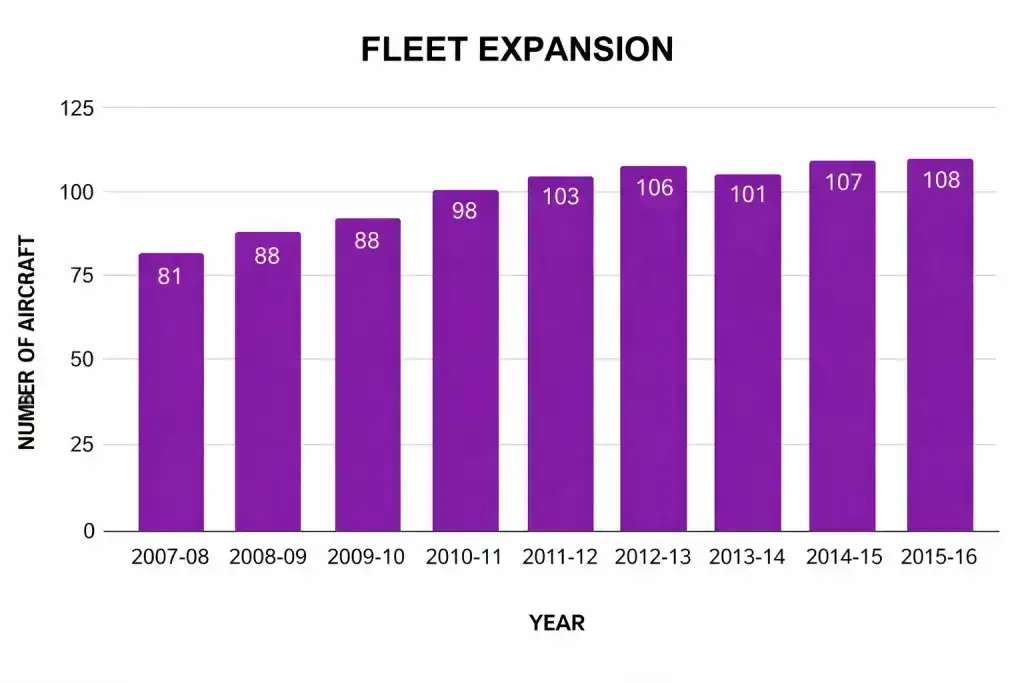
During the same time period, Jet Airways expanded and increased its market share by purchasing Air Sahara in 2007. Even though such decisions increased Jet’s reach, they also required significant investments.
This ambitious expansion laid the foundation for the financial pressures that would follow, setting the stage for Phase 2, where we explore how the airline’s rapid growth translated into increasing debt and mounting obligations.
Peter Lynch once quoted, “Know what you own, and know why you own it.”
Phase 2: Rising Debt and the Slow Erosion of Equity
When Jet Airways began expanding at a rapid rate towards the end of the 2000s and early 2010s, the need for capital funding rose. They began operating international flights by introducing new aircrafts.A large proportion of these expansions were debt-financed, as opposed to using internally generated funds or new equity. Over time, this choice began to leave clear footprints on the balance sheet.
To see how financial risk increased over time, it is useful to look at Jet Airways’ debt, equity, and debt-to-equity ratio, based on its financial statements and publicly available data.
Jet Airways: Debt, Equity, and D/E Trend

Warren Buffet quotes,“Risk comes from not knowing what you’re doing.”
The most important insight here is not a single year’s ratio, but the direction of change.
In the early years, Jet Airways still had positive equity. Even though debt was rising, the company had some financial cushion. As long as equity remained positive, the Debt-to-Equity ratio could still provide a rough sense of leverage.
However, as losses accumulated year after year, equity kept shrinking. By the mid-2010s, Jet’s equity base was effectively wiped out and eventually turned negative. At that point, the Debt-to-Equity ratio stopped being a useful number altogether. Negative equity is not just a warning sign; it indicates that the company’s liabilities exceed its assets.
This is a crucial concept for investors to understand. Many people focus only on whether debt is rising. What often gets missed is what is happening to equity at the same time. In Jet Airways’ case, debt was increasing while equity was collapsing. That combination dramatically increased financial risk.
Even when revenues were still coming in, the balance sheet had become fragile. Jet Airways was required to pay interest on its loans, lease obligations, and other fixed costs no matter how well or poorly it was performing financially. After using all of its equity cushion, the company had no financial room for error. Any disruption in cash flow caused by increasing fuel prices, fluctuating currencies, lower demand for products and services, or delayed customer payment, would put the company at risk of distress.
This phase of Jet Airways’ journey highlights why the Debt-to-Equity ratio must always be read in context and over time.
A single year’s number can be misleading. What matters is the trend: rising leverage combined with eroding equity steadily removes a company’s ability to absorb shocks.
For investors, especially in capital-intensive businesses, this is where balance-sheet analysis becomes non-negotiable. Long before operations stop or headlines turn negative, the warning signs usually appear quietly in the numbers.
Phase 3: Insolvency, Creditor Impact, and the Investor Reckoning
As the end of 2018 approached, Jet Airways had almost collapsed financially as a result of years of increasing debt and falling - ultimately negative-net equity. With no financial reserves available, it is clear that Jet was heading in the wrong direction.Even though revenue generation and passenger demand continued strong at the beginning of 2019, Jet could not meet its fixed liabilities anymore. The company indicated the beginning of Jet's operational distress as salary payments, lease rents, fuel payments, and airport fees were not being paid on time.

The airline’s failure to submit mandatory financial disclosures and monthly “No Default Statements” led ICRA to place Jet Airways under the “Issuer Not Cooperating” category. This credit rating downgrade reflected the seriousness of the situation and confirmed that lenders and investors had little clarity about the company’s true financial health.
In April 2019, Jet Airways suspended all flight operations. The Company went into suspension after a long accumulation of leverage over many years, and a decline in the value of their equity base.
After a short time, they filed for insolvency under IBC and the case has been set before NCLT for handling.
The full scale of the company’s obligations became visible through the NCLT process. Jet Airways had dues payable to a whole list of creditors, including banks, aircraft lessors, suppliers, employees, and government authorities.
The aggregated debt stood at ₹ 36,500 crores, thereby indicating the pressure of leverage on all stakeholders if it goes unchecked.
Jet Airways: Creditor Snapshot at the Time of Insolvency

Reports from investigations indicated that the money obtained by Jet Airways from the marketing of its expansion was used by Jet Airways to fund personal use by the Jet Airways promoters instead of being fully used for Jet Airways operations.
The reports indicated that the diversion hurt the creditors' confidence and hindered recovery opportunities; creditors may have considered that the combination of excessive leverage and failure to manage governance-related issues created an opportunity for Jet Airways's quick collapse.
With frozen cash flow and accumulating obligations, Jet Airways was in a position of no financial flexibility. Assets available for liquidation were far below total claims, leaving equity holders with nothing.
The NCLT process crystallised losses across all creditor classes — banks took haircuts, lessors recovered partially, suppliers were left unpaid, and employees faced delayed settlements.
The Jet Airways story demonstrates in stark terms why the Debt-to-Equity ratio is not just an abstract metric. When debt is high, and equity erodes to zero, even a large, well-known company can collapse.
Investors who had monitored D/E trends would have seen the warning signals long before operations ceased.
As Warren Buffett once said:
“Only when the tide goes out do you discover who’s been swimming naked.”
The story of Jet Airways is an example in the real world that leverage can be used to grow quickly but when paired with bad governance and a loss of equity, it can lead to a path of no return.
Investors—especially those who focus on small- and/or mid-cap businesses—should be aware that in addition to focusing only on revenue growth or increasing market share, investors should also evaluate the strength of a company's balance sheet, the ability of a company to preserve equity, and how responsibly a company is utilizing leverage.
Jet Airways’ story shows that debt doesn’t exist in isolation. Its impact depends on the business model, cash flow stability, and equity cushion. Understanding these dynamics is critical before even comparing sectors, because in smaller businesses, financial missteps can snowball faster than in large, established firms.
Why Debt-to-Equity Matters More for Small-Cap Investing
If an already established mid-sized airline can run into such serious trouble, smaller companies- being less stable and more unpredictable face an even greater risk.
Smaller companies usually face
- limited profits
- weak cash flow
- limited funding opportunities.
They get into financial troubles easily, even due to a temporary setback, an increase in expenses, or a glitch in operations, because they lack the safety nets that come with a known flow of revenues.
For investors, this is why tracking the Debt-to-Equity ratio in small-cap stocks is critical.
D/E reveals
- How growth is funded
- Whether obligations can realistically be met
- Whether the company can survive when revenues dip.
In the case of Jet Airways, the company appears to be a warning sign. Debt, along with diminishing equit,y could spell disaster even when the company enjoys a popular name.
By focusing on trends in D/E, industry norms, and erosion in equity, investors would be able to anticipate risks early and distinguish between strategic leveraging and risky leveraging.
Want a step-by-step approach? Check out Link: A Fundamental Checklist: How to Research a Stock in 1 Hour.
Debt-to-Equity Across Sectors: Typical Ranges & Examples
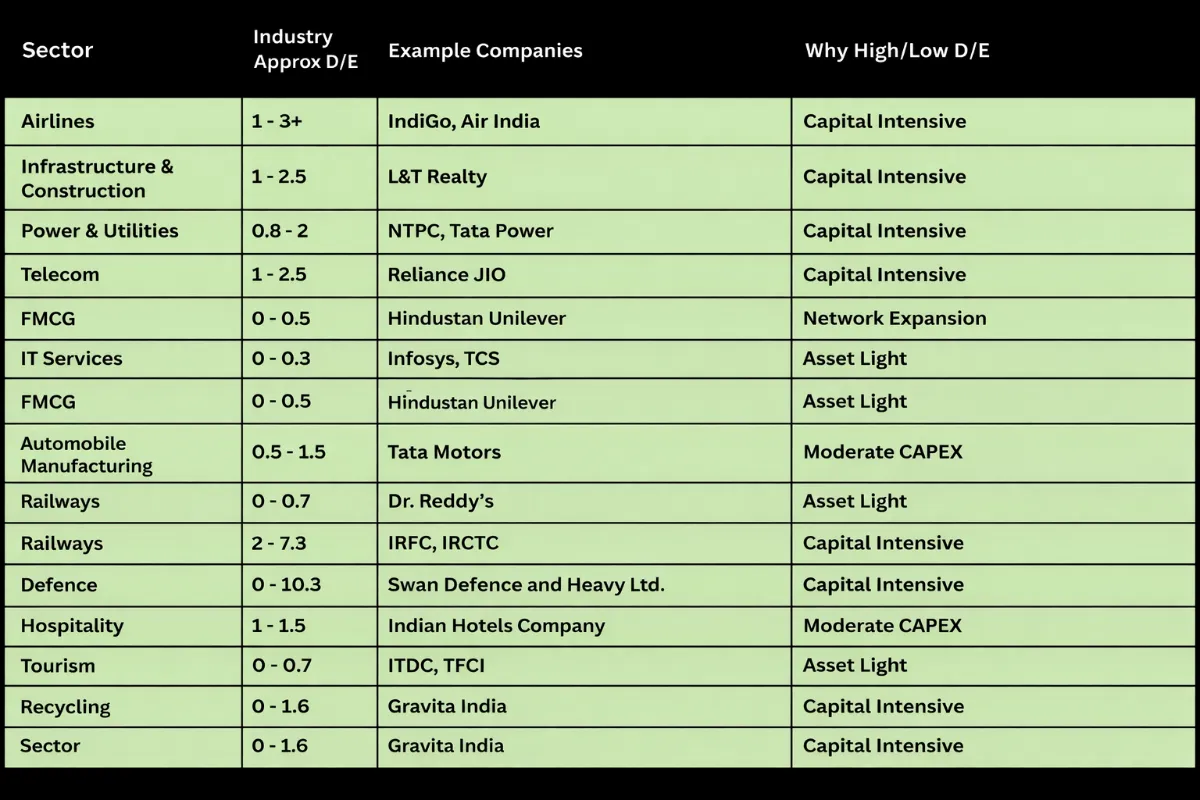
From the above table, it can be noted that certain sectors, for example, air transportation, telecom, and infrastructure, inherently have higher leverage, while IT services, FMCG, and Pharma have negligible debt.
Investors should compare companies in the same industry in terms of their cash flow and equity, rather than focusing on the absolute value of the D/E ratio.
Learn why mid-cap stocks often hit the sweet spot: Link: Why Mid Cap Stocks are the Sweet Spot for Long-Term Investors.
Another useful tool for assessing leverage risk is credit ratings. Ratings from agencies like ICRA or CRISIL reflect a company’s ability to meet its debt obligations.
For example, Jet Airways’ rating was moved to “Issuer Not Cooperating” in 2019 due to the non-submission of required financial statements, signalling to investors that the company’s leverage and repayment capacity were highly uncertain. A declining rating often precedes financial stress, making it an important complement to analysing D/E ratios.
Seeing these sectoral differences and credit ratings together makes one thing clear: a Debt-to-Equity number alone doesn’t tell the full story. Even a moderate D/E ratio can signal trouble if cash flows weaken, equity is depleted, or the credit rating indicates growing repayment risk.
Understanding where companies are in their sector and how credit agencies perceive them is the first step for investors to recognise likely red flags.
Understand strategic growth in Link: The Multibagger Framework: A Step-by-Step Guide to Finding 10x Stocks.
To avoid costly errors, investors must also watch for some common mistakes when reading D/E ratios — especially in small and mid-cap stocks.
Common Mistakes Investors Make When Analysing Debt-to-Equity Ratios
Even after understanding D/E and sector norms, many investors trip up because they focus on the wrong things. Here are the most frequent mistakes to watch out for:1. Looking at just one year’s D/E
A single year’s number can be misleading. Companies may take on temporary debt for expansion or repay it quickly afterwards. Without seeing the trend over multiple years, it’s hard to know if leverage is being managed responsibly. For example, Jet Airways’ D/E might have looked moderate early on, but the ratio kept climbing as equity declined, signalling rising financial risk long before the crisis became visible.2. Ignoring peers and industry context
A D/E ratio of 1.5 might be normal for an airline or infrastructure firm, but dangerously high for an IT services company. Comparing within the same sector is crucial. Investors who ignore industry norms can mistake safe leverage for a red flag — or vice versa.
3. Focusing only on debt, not equity
Debt alone doesn’t tell the whole story. If equity is growing, high debt may be manageable. But if equity is shrinking or turning negative, even moderate debt becomes risky. Always consider how debt relates to shareholder capital — the essence of the D/E ratio.4. Overlooking cash flows
Even a company with a low D/E can struggle if cash flows are inconsistent. Debt obligations are fixed — interest and principal payments don’t pause for bad months. Investors who ignore operating cash flows may misjudge a company’s ability to service its debt.
5. Assuming high D/E is always bad
Some investors panic when they see high leverage, without checking purpose and management strategy. In capital-intensive sectors, high D/E may be perfectly reasonable if projects generate predictable long-term returns.
6. Ignoring equity erosion or dilution
Frequent losses or issuing new shares can reduce equity, which in turn pushes D/E higher. Investors who look at debt only, without tracking equity trends, may miss the real risk building quietly on the balance sheet.Investor takeaway: D/E is a powerful tool — but only when read in context. Look at trends over time, compare with sector peers, consider both debt and equity, and check cash flows. These steps separate careless analysis from smart, risk-aware investing.
See more common small-cap mistakes in Link: Common Mistakes Every Small Cap Investor Makes (And How to Avoid Them).
Philip Fisher says,
“The stock market is filled with individuals who know the price of everything, but the value of nothing.”
By avoiding these common pitfalls and understanding how debt interacts with equity, cash flows, and industry norms, investors can make smarter decisions — especially in small-cap and mid-cap companies where the margin for error is thin.
With this perspective, let’s wrap up with the key takeaways every investor should remember about Debt-to-Equity.
Explore our Products
Research Framework

Emerging Titans
Combination of quantitative analysis, industry tailwinds, and management assessment - SPRINT investment philosophy

Tiny Titans
Heavy emphasis on scuttlebutt research, plant visits, and early on-ground signals
Conclusion
In the words of Rakesh Jhunjhunwala, “In investing, you don’t need many big winners. You just need a few, and you need to ride them fully.”Most investors don’t get hurt by flashy growth or headlines—they get hurt by overlooking the balance sheet. Understanding a Debt-to-Equity ratio is just the starting point. What truly matters is knowing why a company borrows, how it manages repayment, and whether cash flows are strong enough to sustain obligations if the business hits a rough patch.
A structured approach to investing—especially in small and mid-cap stocks—is not about avoiding all debt. It’s about spotting which companies use leverage strategically to grow, and which are exposed to financial risk. Monitoring trends in D/E, sector norms, equity erosion, and cash flows gives investors the early signals needed to separate manageable risk from hidden danger.
If this article helped you see the difference between careless borrowing and strategic leverage, comment “LEVERAGE” below.
Like, share with fellow small-cap investors, and comment one metric you’ll now check before investing.
Remember: the strongest investing edge often comes not from chasing high returns, but from avoiding financial traps consistently.
FAQs ( Frequently Asked Questions )
What is a good Debt to Equity ratio for small-cap companies?
A “good” D/E ratio depends on the industry. For capital-intensive sectors like infrastructure or airlines, a higher ratio is normal. For FMCG or IT, lower is safer. Generally, below 1 is considered manageable, but context matters more than the number.
Can a company have negative Debt to Equity?
+Yes. Negative D/E happens when a company has negative shareholders’ equity, usually due to accumulated losses. This is a warning sign—it means the company is financially stressed and may struggle to take on new debt.
Does a high D/E always mean a company is risky?
Not always. High D/E can amplify returns if the company’s cash flows are strong and predictable. The key is whether debt is strategic and manageable, not just the absolute number.
Should beginners avoid companies with high D/E?
Beginners should be cautious but not avoid them outright. Look at why the debt exists, the trend over time, and cash flow support. A company using debt for growth with strong earnings is different from one borrowing to cover losses.
How often should I check a company’s D/E ratio?
At least annually with published financial statements. For small-cap stocks, also monitor half yearly updates if available—these companies can be more volatile
Can D/E predict stock price movements?
+No. D/E shows financial leverage, not market performance. But it helps assess risk, so you can avoid companies that might struggle if business conditions change.
What other metrics should I check along with D/E?
Always combine D/E with:
Cash flow statements – ensures debt can be serviced.
Return on Equity (ROE) – shows efficiency.
Profit margins – check stability.
Debt maturity & interest costs – helps gauge repayment risk.

High growth stock specialist, Value Educator
Shashank Mahajan is an equity research professional with over 12 years of experience in identifying high-potential SME and micro-cap stocks at an early stage. He follows a rigorous scuttlebutt research–driven approach, combining on-ground insights with deep financial analysis. Shashank specializes in uncovering under-researched and under-owned companies with strong management quality and long-term growth potential. Through disciplined research and early identification, he focuses on spotting tomorrow’s market leaders before they enter the mainstream investor radar.

Glenmark: The USD 700 Mn Cancer Deal and Its Brands

Pharma Stocks in India 2026: Generics, APIs and CDMOs

Granules India: From Paracetamol to a 65% Gross Margin

Natco Pharma: After Revlimid, 29 Patent Challenges

Shilpa Medicare: Cancer APIs, Films and Biosimilars

Alembic Pharma: US Plants Pay Back, Margin Hits 22.2%
Explore our Products
Research Framework
Emerging Titans
Combination of quantitative analysis, industry tailwinds, and management assessment - SPRINT investment philosophy
Tiny Titans
Heavy emphasis on scuttlebutt research, plant visits, and early on-ground signals



Modern Warfare to Multibaggers
Key Trends. Strategic Shifts. Opportunities Ahead.
Today at 7:00 PM IST. Room opens 30 minutes before.
Don't Miss This Exclusive Webinar!
Join Value Educator to decode the key trends shaping India's defence sector and learn how to identify tomorrow's potential leaders in the space.
- In-depth research on India's defence sector
- Live Q&A session
- Actionable takeaways for long-term investors

 Orders
 Subscription
 Share with friends


Required Details
₹23999.00
(12 month subscription)
As per SEBI regulations, all users are mandated to complete the KYC that is validated for 1 year. Post payment, you will be redirected to the KYC screen


No comments yet. Be the first to comment!