
Schneider Electric Infrastructure: ₹2,701 Cr Order Backlog
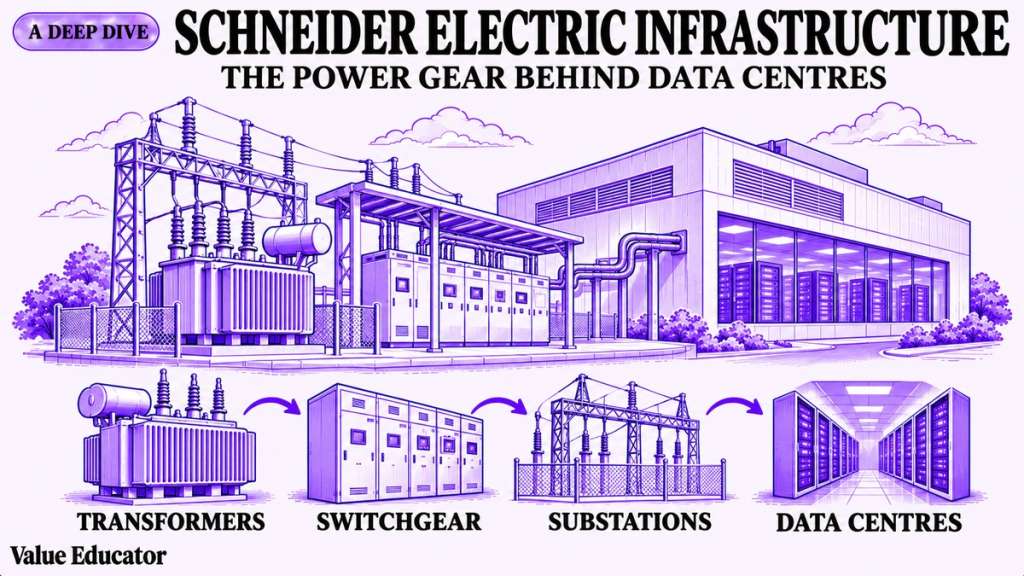
A large data centre does not take power the way a house does. The electricity reaches its gate at 132 kV, a voltage meant for long lines across a state. Before a single server can use it, that power has to be stepped down, switched and protected, floor by floor, until it reaches the racks at 415 volts.
That job needs a chain of heavy equipment. A transformer is a machine that changes the voltage from one level to another. Medium-voltage switchgear is the set of panels and breakers that switches power on and off and cuts it off within a fraction of a second when a fault appears. A ring main unit, or RMU, is a compact switch box that keeps power flowing from a second side if one cable fails.
The same chain is found in a steel plant, a metro line, a semiconductor fab and the substations that a state power company runs. In each of them, a failure in this gear can stop the whole site, so buyers care a great deal about who made it.
One Indian company makes most of this chain in two cities, Vadodara and Kolkata. In the July to September quarter of 2026 it booked ₹1,265 Cr of new orders, the most in any quarter of its history. Its order backlog reached ₹2,701 Cr, up 49.6% in a year.
That company is Schneider Electric Infrastructure Ltd (NSE: SCHNEIDER), the listed Indian arm of the French group Schneider Electric for power distribution. In March 2022 its net worth was about ₹36 Cr. In March 2026 it was ₹774 Cr.

So the company sits at a clear point in the data-centre chain. It does not build the halls, the servers or the cooling. It makes the gear that brings grid power into the site and spreads it safely to every floor.
Schneider Electric Infrastructure in five numbers
- An order backlog of ₹2,701 Cr in September 2026, up 49.6%
- Record quarterly orders of ₹1,265 Cr in Q2 FY27, up 50.9%
- Q2 FY27 sales of ₹779 Cr, up 19.8%
- An EBIT margin of 7.2%, against 12.5% a year ago
- Data centres at about 10% to 12% of the order backlog in June 2026
So orders are rising fast, while profit has fallen. How did both happen in the same quarter? Let's first understand the company, and then look at the latest quarter.
Schneider Electric Infrastructure: Company Overview
Schneider Electric Infrastructure Ltd was incorporated on 12 March 2011. Its registered office is near Vadodara in Gujarat and its corporate office is in Gurugram. It is part of the Schneider Electric group of France, and the promoter group holds 75% of its shares, mostly through Energy Grid Automation Transformers and Switchgears India, which holds 70.57%. Udai Singh is the Managing Director and CEO, and Pravin Kumar Purang is the Chairperson. The company makes transformers, medium-voltage switchgear, ring main units, vacuum interrupters, breakers, relays and E-Houses, along with monitoring software and services, in plants at Vadodara and Kolkata. Its total workforce was 2,255 people in March 2026. Sales were ₹2,891 Cr in FY26, and its order backlog stood at ₹2,701 Cr in September 2026; its borrowings of ₹455.7 Cr are loans and preference shares from group companies. Read this Data Centre Stocks in India 2026: Suppliers and Operators
"Know what you own, and know why you own it."
— Peter Lynch
The Schneider name is best known for products inside buildings and data halls, but this listed company makes the medium-voltage power path that feeds them. Knowing which products it actually sells is the first step to reading its results.
The Quarter Orders Hit a Record and Margins Fell
Let's look at Q2 FY27, the July to September quarter that the company reported on 5 November 2026. Sales were ₹779 Cr, up 19.8% from ₹650 Cr a year ago and 19.6% higher than the ₹651 Cr of Q1 FY27. Order intake was ₹1,265 Cr, up 50.9%, and ahead of the earlier record of ₹915 Cr set just one quarter before.

As we can see, the top line and the bottom line moved in opposite directions. Material costs rose 28.3% to ₹509 Cr, against a 19.8% rise in sales, so the gross margin came down to 35.3% from 39.7%. EBITDA was down 26.2% at ₹65 Cr, at a margin of 8.4% against 13.6%. Read this EBITDA Explained: Uses and Limits Profit after tax was ₹30 Cr, against ₹52 Cr a year ago, down 43.3%.

So we see two trends in one quarter: orders that keep rising and a margin that is still recovering after a hard year. Let's see where that margin squeeze came from. It came mostly from metals. Copper and transformer oil kept getting costlier, both from the previous quarter and from a year ago. Steel and aluminium also rose, and a lower rupee made the imported parts dearer. On top of that, employee costs rose 25.2% and other expenses 22.4%, partly because some costs are paid in foreign currency.
Contracts explain why those costs could not simply be passed on. Management says the orders booked before December 2025 carry a firm price, so the company has to absorb any later rise in metal prices. It also says projects make up close to 65% of the business. Only about 20% to 25% of those projects are protected by price variation clauses, which let a supplier raise the price if input costs rise.
The rest are mostly tenders from state utilities and public sector buyers, where the tender itself asks for a firm price. If the company insists on a price clause there, it is not allowed to bid. Management gave an example: an order priced in April with a buffer for costs still lost money when input costs rose by another 10% by June.
Still, the quarter was better than the one before. The EBIT margin was about 4.9% in Q1 FY27 and 7.2% in Q2 FY27, as the company began to deliver orders booked at today's costs. Sales in Q1 were held back because customers were not ready to take delivery, and part of that moved into Q2.
That same pattern shows in the first half. H1 FY27 orders were ₹2,180 Cr, up 24.7%, and sales were ₹1,430 Cr, up 12.5%. EBIT was ₹88 Cr, or 6.2% of sales, against ₹148 Cr and 11.6% a year ago. Profit after tax for the half was ₹42 Cr, down 55.0%.
That growth also asked for cash. Operating cash flow was negative at about ₹29.2 Cr in H1 FY27, against a positive ₹83.7 Cr a year ago. Inventory rose by about ₹115 Cr in six months, to ₹536.1 Cr, as the company bought material for a larger backlog. Cash came down to ₹247.5 Cr in September 2026 from ₹357.9 Cr in March. Receivables, the money customers still owe, were ₹794.2 Cr, a little below the ₹812.7 Cr of March, so the cash went into stock rather than into unpaid bills.
Finance cost also rose, to ₹15 Cr from ₹11 Cr, even though the company did not borrow more. Its borrowings were ₹455.7 Cr in September 2026, against ₹443.8 Cr in March. These are not bank loans. They are an inter-corporate deposit from a Schneider group company and 8% preference shares held by group companies, and their interest rate moves with the RBI's rates.
The Backlog Behind the Next Year
Now let's look at the orders, because they show how much of the coming revenue is already booked. The order backlog is the value of orders received but not yet delivered.
That backlog was ₹2,701 Cr in September 2026. It was ₹1,226 Cr in March 2024 and ₹1,253 Cr in March 2025. Then it rose to ₹1,911 Cr in March 2026, ₹2,169 Cr in June 2026 and ₹2,701 Cr in September. So the backlog more than doubled in eighteen months.
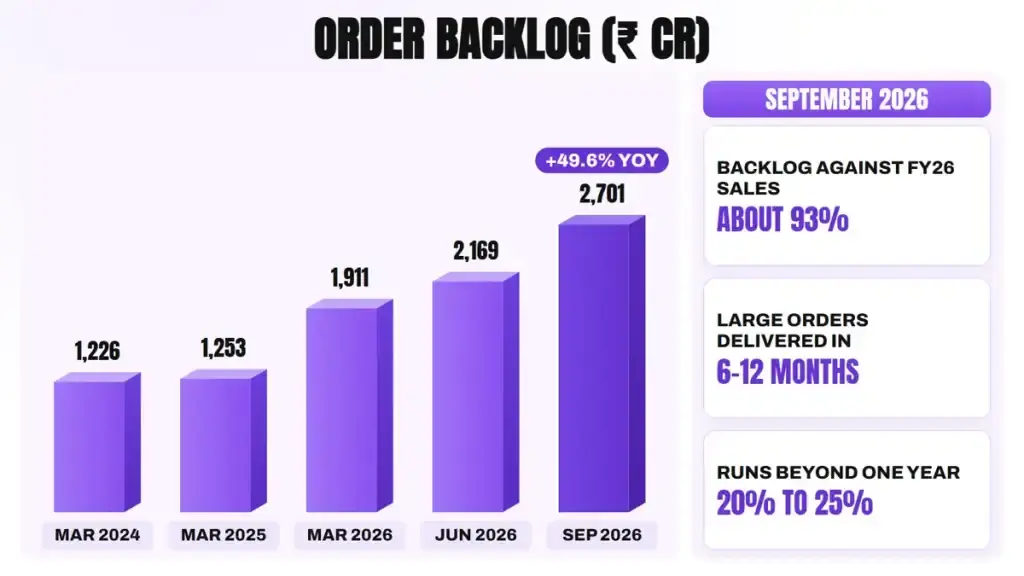
That backlog is about 93% of the ₹2,891 Cr of sales in FY26. Management says large orders are delivered over 6 to 12 months, and some take longer. Engineered-to-order products for a single customer take five to six months on average. About 20% to 25% of the backlog usually runs beyond one year.
What the backlog says: ₹2,701 Cr is close to a full year of FY26 sales. But a part of it was priced before costs rose, so the backlog promises revenue more clearly than it promises margin.
That record quarter also did not depend on one large order, management says. Asked about it, the MD and CEO said there was no large ticket order in Q2 FY27. Demand came from both the older segments and the newer ones, such as data centres and semiconductors. In August 2026 management said more than one-fifth of its order bank came from these emerging segments.
That order flow is running well ahead of sales. In H1 FY27 the company booked ₹2,180 Cr of orders against ₹1,430 Cr of sales, so it took in about ₹1.52 of new orders for every rupee it billed. The backlog grew by about ₹532 Cr in the September quarter alone. For the year, the second half has to carry more: in FY26, H2 sales were about ₹1,619 Cr, against ₹1,272 Cr in H1.
How Schneider Electric Infrastructure Turned Around
Now that we have seen the quarter, let's go back and see how the company got here. Schneider Electric Infrastructure was incorporated on 12 March 2011, and it is part of the Schneider Electric group, a global energy-technology company. The promoter group holds 75% of the shares, mostly through Energy Grid Automation Transformers and Switchgears India, which holds 70.57%.
Before that, the company struggled for most of the 2010s. In FY21 it made a small loss of about ₹1 Cr on revenue of about ₹1,297 Cr. In March 2022 it carried an accumulated loss of about ₹324 Cr, and its net worth was only about ₹36 Cr, against debt of about ₹506 Cr. Its debt was 14 times its equity.

Then the profit came back, year after year. Sales grew from ₹1,530 Cr in FY22 to ₹2,891 Cr in FY26. Profit after tax went from ₹28 Cr to a peak of ₹268 Cr in FY25. Because the company kept its profits, net worth rose to ₹774 Cr, and debt to equity came down to 0.7 times in FY26.
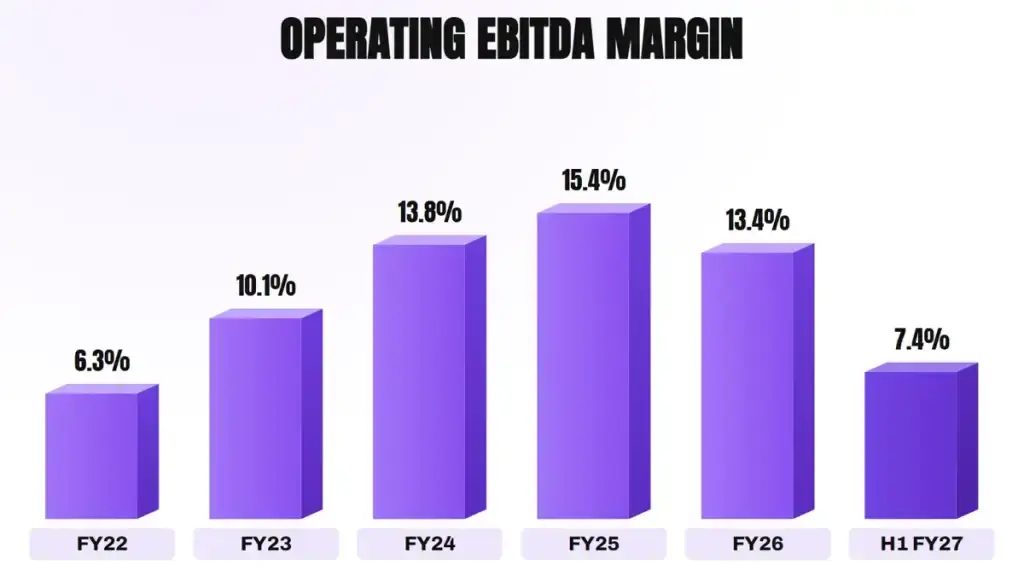
That chart shows the turn and the recent slip. The operating EBITDA margin climbed from 6.3% in FY22 to 15.4% in FY25. It eased to 13.4% in FY26, when sales grew 9.6% but EBITDA eased 4.6% to ₹388.8 Cr. In H1 FY27 it was 7.4%. So the margin is now back near where it was in FY23.
That recovery also showed in cash. Operating cash flow was about ₹120.4 Cr in FY22, ₹87.6 Cr in FY23, ₹189.4 Cr in FY24, ₹307.9 Cr in FY25 and ₹224.5 Cr in FY26. Over those five years it added up to about ₹929.8 Cr, against about ₹805 Cr of profit after tax. So the company turned more than its full profit into cash over this period. Read this Cash Flow Statement Explained
Those years of cash also paid for the plants. There was no change in its share capital in FY26, and its borrowings are still the same group loans and preference shares. Its total workforce was 2,255 people in March 2026, and women made up 18.7% of it.
"Specifically on the material margin, if you just carve it out the commodity price, then our margin is well on track." - Omkar Prasad, CFO, November 2026
That is management's own reading. The test of it will come when the orders booked at current prices form most of what the company delivers.
What Schneider Electric Infrastructure Makes and Sells
Now let's split the business into its parts, because each one is sold in a different way. The company reports a single business segment, products and systems for electricity distribution. In FY26, manufacturing brought in 89.1% of turnover, services 7.6% and trading 3.2%.
These lines sound alike, but as you will see, each one has its own buyer and its own way of winning orders. Equipment such as RMUs, breakers and relays is sold as standard products, often through partners. Projects, such as E-Houses and substations, are won in tenders. Services cover spares, maintenance and modernisation of old sites.

Those buyers have a clear core. Management said in November 2025 that power and grid customers make up a shade less than half of the business. Renewables and mobility were each in good double digits, and data centres almost in double digits. Exports were 11% of FY26 turnover, and the company sold to 49 countries.
That power and grid core depends heavily on one government scheme. The Revamped Distribution Sector Scheme, or RDSS, is a central plan to upgrade the networks of state power distribution companies, with about ₹3 lakh crore committed. Management says it has been extended for another two years, and that about ₹18,000 Cr of it is due to be spent in the current year. This is the kind of spending that buys RMUs, switchgear and transformers for utilities.
"Show me the incentive and I will show you the outcome."
— Charlie Munger
For a supplier to state power companies, the incentive sits in government schemes such as RDSS. When the money for grid upgrades flows, orders for distribution gear follow, and when it slows, so do they.
Transport is the next core market. Management says most of India's Vande Bharat trains run on equipment it makes, and its breakers go into locomotives too. Metro lines in West India and an automation order for a metro in Mumbai add to this.
Transformers from Vadodara
Let's start with transformers, the largest piece of equipment in most orders. The Vadodara plant makes oil-filled distribution and power transformers, and the company is now adding Trihal dry-type transformers. A dry-type transformer uses no oil, so it is safer indoors, which is why management names data centres, metros, hospitals and commercial buildings as its users.
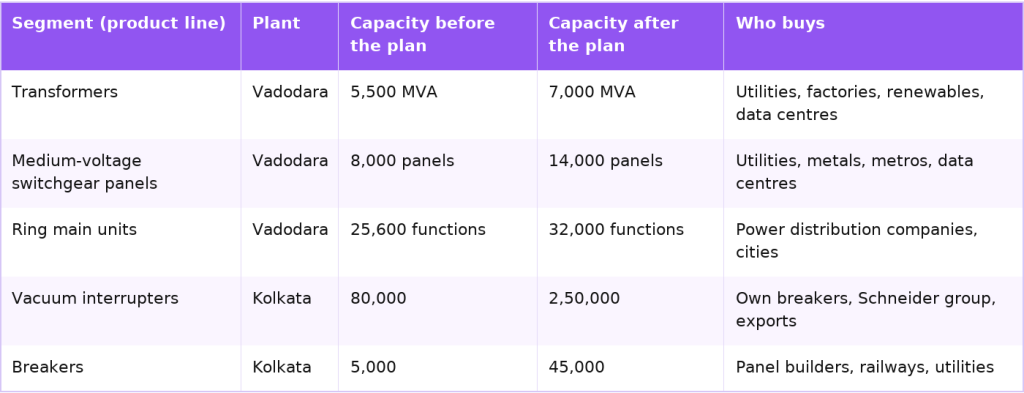
That line is also moving up in size. In FY26 the company won a direct order for a high-capacity power transformer from a chemicals and fertiliser maker, which it calls its entry into the high-rating transformer segment. The expansion plan takes transformer capacity from 5,500 MVA to 7,000 MVA.
Switchgear and Ring Main Units
Next, let's look at the switchgear, the panels that sit between the transformer and the load. The company makes air-insulated switchgear, gas-insulated switchgear and RMUs. In FY26 it launched GMSeT, a gas-insulated switchgear for up to 36 kV with sensors built in for health monitoring.
These products carry the company's digital layer. Its EcoStruxure software and sensors let a customer watch the temperature and health of each panel from a control room. It also sells SF6-free switchgear, which avoids SF6, a gas with a very high greenhouse effect, and it ran a pilot of an SF6-free smart RMU with a Delhi power distribution company.
Vacuum Interrupters and Breakers in Kolkata
Now let's move to Kolkata, the part of the business that is growing fastest in capacity. A vacuum interrupter is the sealed bottle inside a medium-voltage breaker where the current is cut. The company makes it in Kolkata for its own breakers, and the expansion is also meant to support exports.
That plant has been expanded twice in four months. In July 2026 the board raised the vacuum interrupter plan from 1,80,000 to 2,50,000 units a year, at a cost of ₹184 Cr. In October 2026 it approved ₹211 Cr more to reach 3,75,000 units and add 18,000 breakers a year by the end of FY29. The new Kolkata plant started operating in January 2026, and in Q2 FY27 it began making the EvoPacT HVX breaker.
That breaker is a 36 kV vacuum breaker with built-in sensors and no SF6 gas. The company says it allows up to twice as many operations and up to 40% lower maintenance. It names solar plants, data centres, battery storage and semiconductor fabs as its users.
That breaker capacity can be set against the market. Management puts India's market for medium-voltage breakers used in air-insulated panels at about 55,000 to 60,000 a year, across 11 kV, 24 kV and 36 kV. The planned breaker capacity of 45,000 a year, plus the 18,000 added in October, is large next to that, which is why exports are part of the plan.
Projects, E-Houses and Services
Finally, let's look at projects and services. An E-House is a prefabricated substation, a steel building with the switchgear, transformers and controls already fitted, which can be shipped to a site and connected quickly. In Q2 FY27 the company booked what it calls its largest E-House order, for a glass maker in South India.
Those services bring in steadier revenue. They include spares, annual maintenance contracts and modernisation of older sites. Management says the modernisation part is growing faster than spares and maintenance, but it is won on price, so it carries a lower margin.
Where Schneider Electric Infrastructure Sits in the Data-Centre Value Chain
Now let's place the company in the wider data-centre chain. A data centre needs land, grid power, water, buildings and cooling before the servers go in. The company's place is the power path inside the site: management says it can supply equipment from the 132 kV point where power arrives down to the 415 volt level, across every floor.
That covers power transformers, medium-voltage switchgear, RMUs, relays and the software that watches them. In Q2 FY27 the company also delivered a skid-mounted station to a data centre in West India. A skid-mounted station is a substation built on a steel frame in a factory, so it arrives ready to plug in and cuts the time needed to commission the site.
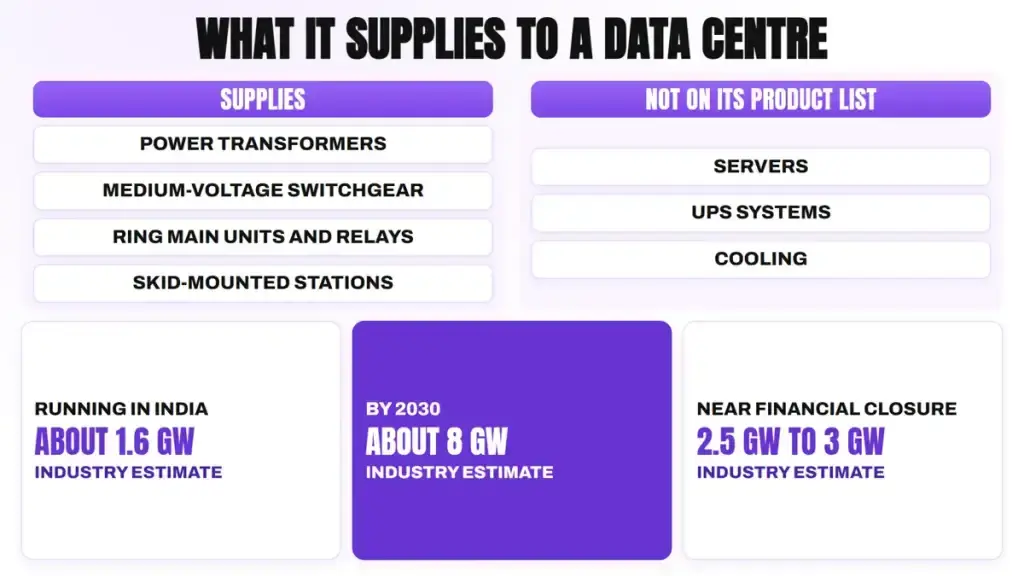
Its data-centre wins so far show the range. In FY26 it supplied medium-voltage switchgear panels for a leading data-centre operator in West India, and switchgear, RMUs and controls with a five-year maintenance contract for the same operator in North India. For a large data centre in South India it supplied transformers and AIS panels with sensor-based monitoring.
That business is still small but growing. In June 2026 management put data centres at about 10% to 12% of the order backlog, and said the share should go up. On the September backlog of ₹2,701 Cr, that range would mean about ₹270 Cr to ₹324 Cr, though the company has not given a newer figure.
That share comes from a large market. Management says India has about 1.6 GW of data centres running, and that industry experts expect about 8 GW by 2030. It adds that about 2.5 GW to 3 GW is in projects that have reached or are close to financial closure. These are industry estimates, not orders.
So when you read about a new data-centre campus in India, you can think of it as a new medium-voltage customer for makers like this one. What we cannot yet see is how much of that demand the company wins, because it gives only a rough share of its backlog and no data-centre revenue figure.
One more point matters here. The Schneider Electric group is also known for the UPS systems and cooling inside data halls. Those are not on this listed company's product list. Its role is the medium-voltage power path, which is also why the same plants serve utilities, metros and factories.
Semiconductor fabs need the same kind of power path, and they are the other new segment management keeps naming. In FY26 the company won the electrical distribution work for India's first semiconductor front-end fab in West India, and in Q1 FY27 it booked what it calls its largest front-end fab order. Like data centres, fabs need power that does not fail, along with digital monitoring.
Why Schneider Electric Infrastructure's Moat Is Hard to Copy
Now that we have seen the parts, let's understand the moat. Transformers and switchgear are made by many companies in India, and many orders are decided on the lowest price. So the question is why a buyer should pick this company over a cheaper local maker. Read this Economic Moat Explained
One part of the moat is the group's technology. The company makes products designed by the Schneider Electric group, which filed more than 1,400 patent applications worldwide in 2025. Products such as the EvoPacT breaker, GMSeT switchgear and EcoStruxure software come from that work, and the Indian company builds them in its own plants.
Another layer comes from the parts that are hard to make. Vacuum interrupters are precision parts, and the company now makes them in its own Kolkata plant. Making them in-house also lets the company cut the imports it used to bring from other Schneider factories, which management puts at 10% to 15% of its material cost.
Another layer is customer trust. Utilities, metros, defence and semiconductor buyers usually prefer suppliers with a long record of working sites, because a failure in this gear can stop the whole site. The company's recent wins include India's first semiconductor front-end fab, metro lines in West India and a naval research facility.
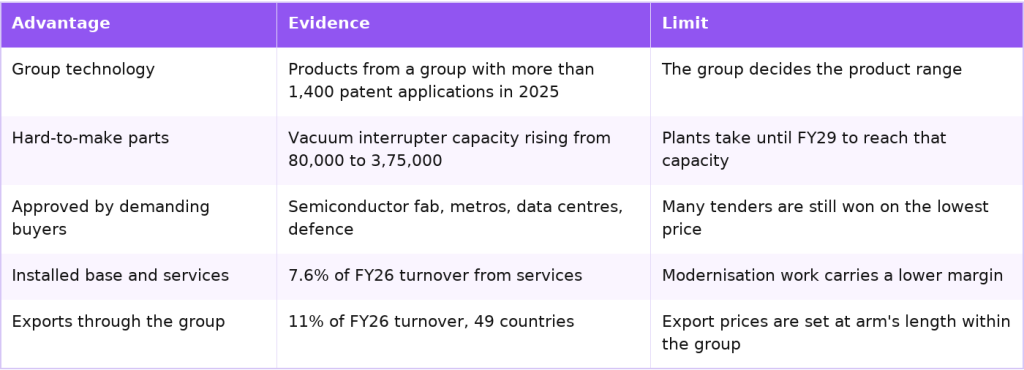
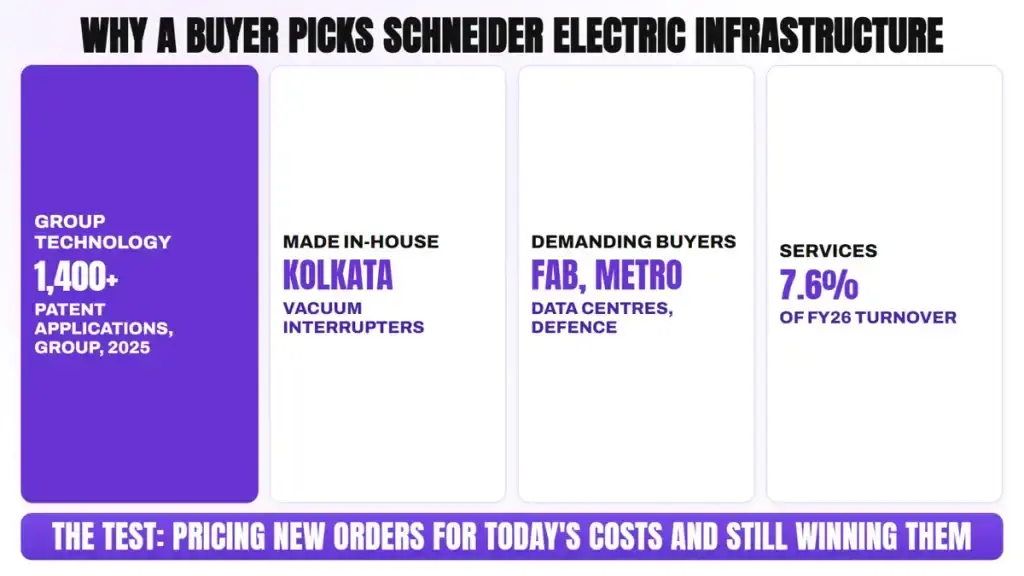
That table shows us why the margin is the real test of the moat. If buyers value the technology and the record, the company should be able to price new orders for today's costs and win them anyway. The record order intake at a time of rising prices is one early sign, but the margin on delivery will settle it.
"The single most important decision in evaluating a business is pricing power."
— Warren Buffett
Schneider Electric Infrastructure is now testing exactly this: whether it can pass higher copper and oil costs on to customers. Its margin over the next few quarters will show how much pricing power it has.
Financials: Five Years of Sales, Margins and Cash Flow
One quarter can mislead in a business where deliveries depend on when customers are ready, so let's look at the full years together. Operating EBITDA here is as the company reports it in its annual report; the first half of FY27 is shown for comparison.
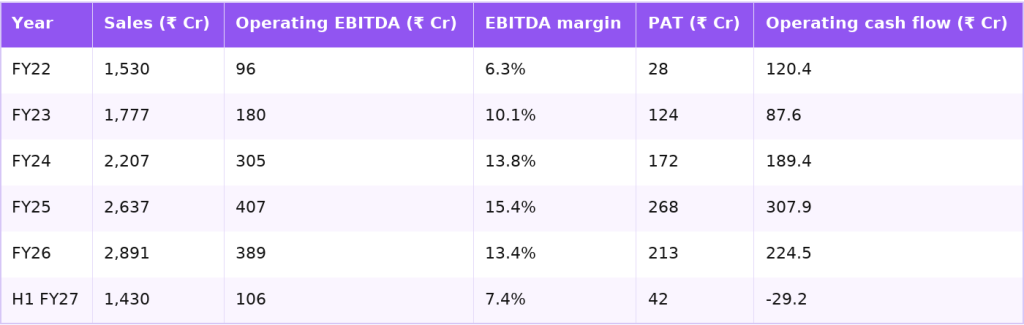
Sales grew about 1.9 times in four years, from ₹1,530 Cr in FY22 to ₹2,891 Cr in FY26, while profit after tax went from ₹28 Cr to ₹213 Cr, after a peak of ₹268 Cr in FY25. The operating EBITDA margin rose from 6.3% to 15.4% before easing to 13.4% in FY26 and 7.4% in H1 FY27, as copper and transformer oil costs rose on fixed-price orders.
Cash flow has kept pace with profit. From FY22 to FY26, operating cash flow added up to about ₹929.8 Cr, against about ₹805 Cr of profit after tax. The first half of FY27 broke that pattern: operating cash flow was negative at about ₹29.2 Cr as inventory rose by about ₹115 Cr for a larger backlog.
The balance sheet has been rebuilt from retained profit. Net worth rose from about ₹36 Cr in FY22 to ₹774 Cr in FY26, and debt to equity came down from 14 times to 0.7 times. The borrowings are group loans and preference shares, so the main test now is whether cash flow can fund the ₹688 Cr capacity plan.
"Does the company have a worthwhile profit margin?"
— Philip Fisher
Fisher asked this of every company he studied. For Schneider Electric Infrastructure the answer was yes in FY25, and the next few quarters will show whether the margin returns as orders priced at today's costs are delivered.
What the Next Two Years Could Look Like on Management's Numbers
So where does the business go from here? Management does not give revenue or margin guidance. Asked about margins in November 2026, the CFO said the company cannot give guidance, but that the dip comes from commodity prices. It added that new tenders are priced at the latest costs.
That leaves capacity as the clearest plan. The capex programme in July 2026 was ₹477 Cr across five product lines in Vadodara and Kolkata. The board added ₹211 Cr in October 2026, taking the total to about ₹688 Cr. Management says it spent roughly ₹500 Cr on its three plants over the last three years.

That capex will be funded from internal cash and, if needed, borrowings. In H1 FY27 the company spent about ₹64.8 Cr on plant and equipment, while operating cash flow was negative. It did not pay a dividend for FY26, to keep cash for capex. Let's put that plan next to the cash it needs. The ₹688 Cr is about 3.1 times the ₹224.5 Cr of operating cash flow in FY26. So if we assume cash flow stays near that level, the plan uses roughly three years of it, and borrowings may be needed if the margin stays low. That is why we would watch cash flow and capex together until FY29.
That plan also has an export angle. Exports are planned to grow with the Kolkata plant, but management expects them to stay close to 12% to 13% of sales, because the home market is growing too.

Those commitments are easier to judge against the past. So let's check what management said before against what it delivered.

That record shows us a clear pattern. Orders and capacity have kept rising ahead of plan, while margins have been the softer part, and management says so. That makes the gross margin and the cash flow the numbers to watch from here.
Key Risks
Now let's look at what could go wrong for Schneider Electric Infrastructure, because the latest half year has already shown some of these risks.
- Commodity prices and firm-price orders: only about 20% to 25% of project orders are protected by price variation clauses. If copper, transformer oil or steel rise again, more of the backlog could be delivered at a lower margin.
- Margin recovery may take time: the EBIT margin was 7.2% in Q2 FY27, against 12.5% a year ago, and profit after tax fell 55.0% in the half year.
- Working capital and cash: operating cash flow was negative at about ₹29.2 Cr in H1 FY27, inventory rose by about ₹115 Cr, and cash fell to ₹247.5 Cr while capex continues.
- Uneven quarters: sales were ₹1,029 Cr in Q3 FY26 and ₹590 Cr in Q4 FY26, because delivery depends on when customers are ready. One slow quarter can make the year look weaker.
- Tax disputes: in March 2026 the company showed contingent liabilities of about ₹39.9 Cr in income tax, about ₹19.2 Cr in older indirect tax cases shared with GE Vernova T&D India, and about ₹64.4 Cr in other indirect tax cases. Several smaller GST orders went against it in October and November 2026, and it is appealing them.
- Dependence on the group: borrowings of ₹455.7 Cr come from group companies, 34% of FY26 purchases and 19% of sales were with related parties, and the group decides which products the listed company makes.
- Data-centre timing: data centres are only about 10% to 12% of the backlog. In November 2025 management spoke of a lull of seven to eight months in data-centre orders, so this demand can pause.
- Lowest-price tenders: many utility and public sector orders go to the lowest bidder, which limits how much of the group's technology shows up in price.
- Currency: imports are 10% to 15% of material cost, so a weaker rupee raises costs, though exports of a similar size give a partial hedge.
"We are becoming a bit choosy and perhaps not taking an exposure where we see larger risk." - Udai Singh, MD and CEO, November 2026
"Only when the tide goes out do you discover who's been swimming naked."
— Warren Buffett
Rising copper and oil prices showed how many of the company's orders carried a firm price. The list below sets out what an investor can watch each quarter.
Explore our Products
Research Framework

Emerging Titans
Combination of quantitative analysis, industry tailwinds, and management assessment - SPRINT investment philosophy

Tiny Titans
Heavy emphasis on scuttlebutt research, plant visits, and early on-ground signals
What to Track Next
If you follow Schneider Electric Infrastructure, these are the signals that will show where it goes next.
- The gross margin after 35.3%, and the EBIT margin against 7.2% in Q2 FY27 and 12.5% a year earlier
- Quarterly order intake against the record ₹1,265 Cr, and the backlog after ₹2,701 Cr
- Operating cash flow for FY27 after the negative first half, and inventory after ₹536.1 Cr
- The share of data centres in the backlog, last given at about 10% to 12%
- Progress at Kolkata towards 3,75,000 vacuum interrupters a year by the end of FY29
- Outcomes of the GST appeals and the other tax cases
For the other listed power companies, from generation to transmission and distribution, see Power Sector Stocks in India 2026: List by Value Chain.
Conclusion
Let's put it all together. Schneider Electric Infrastructure has gone from a net worth of about ₹36 Cr in FY22 to ₹774 Cr in FY26, and from ₹28 Cr of profit to ₹213 Cr. Its order backlog has more than doubled in eighteen months to ₹2,701 Cr, with data centres, semiconductors and the grid all adding orders. The cautious thread is the margin, which was 7.2% at the EBIT level in Q2 FY27 against 12.5% a year earlier, and the cash, which turned negative in the first half. The next two quarters will show which thread is stronger.
Still, the next step depends on margin more than orders. What happens next depends on whether orders priced at today's costs lift the margin back towards its FY25 level, whether the cash tied up in inventory comes back, and whether data centres grow beyond about a tenth of the backlog.
FAQs
What does Schneider Electric Infrastructure do?
+Schneider Electric Infrastructure is the listed Indian arm of the Schneider Electric group for power distribution. It makes transformers, medium-voltage switchgear, ring main units, vacuum interrupters, breakers and E-Houses in Vadodara and Kolkata, and sells monitoring software and services. FY26 sales were ₹2,891 Cr.
How did Schneider Electric Infrastructure do in Q2 FY27?
+Sales rose 19.8% to ₹779 Cr and order intake was a record ₹1,265 Cr, up 50.9%. EBIT was ₹56 Cr, or 7.2% of sales, against ₹81 Cr and 12.5% a year ago, and profit after tax was ₹30 Cr against ₹52 Cr.
What is Schneider Electric Infrastructure's order backlog?
+The order backlog was ₹2,701 Cr in September 2026, up 49.6% in a year and about 93% of FY26 sales. It was ₹1,253 Cr in March 2025. Management says large orders are delivered over 6 to 12 months, and about 20% to 25% of the backlog runs beyond one year.
Where does Schneider Electric Infrastructure fit in the data-centre value chain?
+It makes the medium-voltage power path of a data centre, from the 132 kV point where grid power arrives down to 415 volts on each floor: transformers, switchgear, ring main units, relays and skid-mounted stations. UPS systems, cooling and servers are not on its product list. In June 2026 management put data centres at about 10% to 12% of the order backlog.
Why did Schneider Electric Infrastructure's margin fall?
+Copper, transformer oil and steel became costlier, and orders booked before December 2025 carry firm prices. Projects make up close to 65% of the business, and only about 20% to 25% of them have price variation clauses. The EBIT margin was about 4.9% in Q1 FY27 and 7.2% in Q2 FY27.
What capacity is Schneider Electric Infrastructure adding?
+Its capex programme was ₹477 Cr in July 2026 across five product lines, and the board added ₹211 Cr in October 2026. Vacuum interrupter capacity in Kolkata is planned to rise from 80,000 to 2,50,000 and then 3,75,000 units a year by the end of FY29, with 18,000 more breakers a year.

High growth stock specialist, Value Educator
Shashank Mahajan is an equity research professional with over 12 years of experience in identifying high-potential SME and micro-cap stocks at an early stage. He follows a rigorous scuttlebutt research–driven approach, combining on-ground insights with deep financial analysis. Shashank specializes in uncovering under-researched and under-owned companies with strong management quality and long-term growth potential. Through disciplined research and early identification, he focuses on spotting tomorrow’s market leaders before they enter the mainstream investor radar.
More about Shashank Mahajan →
Azad Engineering vs MTAR vs Unimech: Aerospace Parts
Subros vs Lumax Auto vs Sona BLW: EV Auto Parts Compared
Jyoti CNC vs Macpower CNC: Machine Tool Makers Compared
Data Patterns vs Astra Microwave vs Apollo Micro

Himadri vs PCBL: Carbon Black and Battery Materials

Inox Wind vs Suzlon: Wind Turbine Makers Compared
Explore our Products
Research Framework
Emerging Titans
Combination of quantitative analysis, industry tailwinds, and management assessment - SPRINT investment philosophy
Tiny Titans
Heavy emphasis on scuttlebutt research, plant visits, and early on-ground signals



India's Aerospace Opportunity
Global Demand. Supply Bottlenecks. Opportunities Ahead.
Don't Miss This Exclusive Webinar!
Join Value Educator to decode the key trends shaping India's aerospace sector and learn how to identify tomorrow's potential leaders in the space.
- How the aircraft value chain works, layer by layer
- Indian companies supplying global aircraft makers
- A framework to judge any aerospace company

 Orders
 Subscription
 Share with friends


Required Details
₹23999.00
(12 month subscription)
As per SEBI regulations, all users are mandated to complete the KYC that is validated for 1 year. Post payment, you will be redirected to the KYC screen


No comments yet. Be the first to comment!