
Kalpataru Projects vs KEC International: T&D EPC Compared

Kalpataru Projects International and KEC International are India's two largest listed builders of power transmission lines and substations. Both make their own steel towers, both work in dozens of countries, and both have grown well beyond power into buildings, pipelines, water and railways. That is why investors who want a listed play on India's grid build-out usually end up comparing these two.
The September 2026 quarter pulled them apart. Kalpataru's profit after tax rose 23% to ₹292 Cr and its net debt fell to just ₹72 Cr. KEC's profit after tax fell 82% to ₹30 Cr, as Middle East supply problems and right-of-way delays in India held back work, and its net debt rose to ₹5,614 Cr. This page puts the two side by side on the same periods: FY22 to FY26 from their annual reports, the Q2 FY27 quarter (July to September 2026), and order books at 30 September 2026.
Figures as of 20 November 2026. This page is research, not a recommendation to buy or sell any stock.
Kalpataru Projects vs KEC International at a Glance
| Measure | Kalpataru Projects | KEC International |
|---|---|---|
| Business | Power transmission and distribution (T&D) EPC, plus buildings and factories, oil and gas pipelines, water schemes, railways and urban infrastructure | Power T&D EPC, plus civil (buildings, factories, water), railways and metros, renewables, oil and gas pipelines, and its own cables and conductors |
| Group and leaders | Founded in 1981 (formerly Kalpataru Power Transmission); founder and chairman Mofatraj P. Munot, MD and CEO Manish Mohnot | Flagship of the RPG group; chairman H. V. Goenka, MD and CEO Vimal Kejriwal |
| Reach | 75+ countries, 250+ projects under execution | 110+ countries (including supply of towers and cables), 250+ ongoing projects |
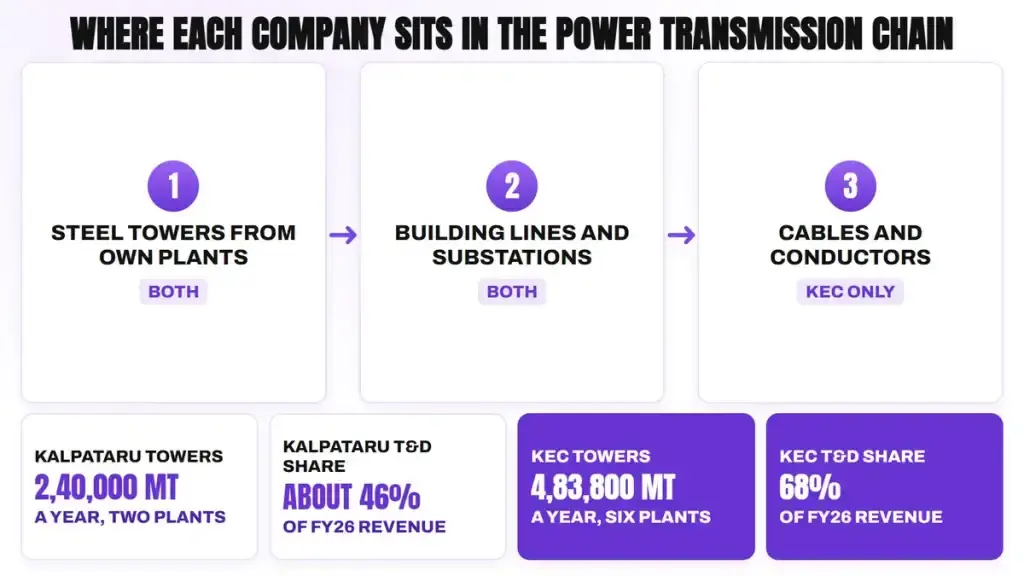
| Plants and capacity | Two tower plants (Gandhinagar and Raipur), 2,40,000 MT a year | Six tower plants (3 in India, Dubai, Mexico, Brazil) with 4,83,800 MT a year of towers, poles and structures; cable plants at Vadodara and Mysuru |
| FY26 revenue | ₹27,143 Cr, up 22% | ₹23,506 Cr, up 8% |
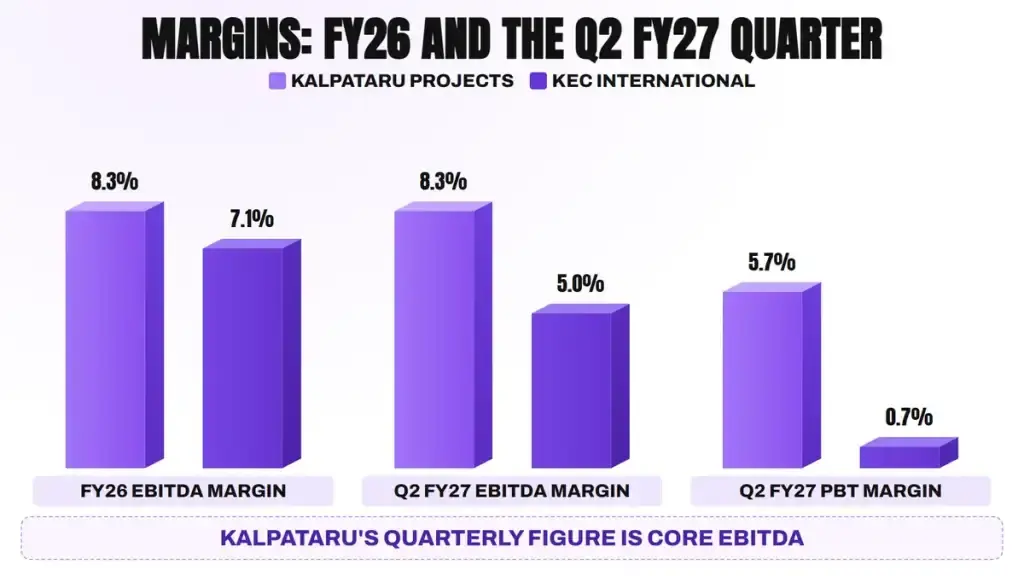
| FY26 EBITDA margin | 8.3% (₹2,240 Cr) | 7.1% (₹1,659 Cr) |
| FY26 profit after tax | ₹1,031 Cr | ₹606 Cr |
| Returns, FY26 | ROCE 21.4%; return on equity about 14.4% (our calculation) | ROCE not disclosed; return on net worth 10.5% |
| Net debt, 30 Sep 2026 | ₹72 Cr | ₹5,614 Cr (₹7,793 Cr including interest-bearing acceptances) |
| Order book, 30 Sep 2026 | ₹71,846 Cr, up 11% in a year | ₹39,946 Cr, up about 2% in a year |
| Q2 FY27 revenue growth | +7% reported (+13% excluding road assets and Brazil) | -10% |
| Customers | About 65% of FY27 T&D orders so far from major domestic clients; Linjemontage serves grids in Sweden and Norway | PGCIL (its largest-ever India T&D order came from PGCIL in Q2 FY27), private developers, Middle East and Americas utilities |
| Key risk | Middle East supply and freight costs; about ₹1,500 Cr of water-scheme receivables, two-thirds overdue | Net working capital of 155 days, net debt, and a Middle East region that is about 25% of its order book and L1 |
In short, Kalpataru is now larger, more profitable and almost free of net debt. KEC is the more focused power company, with about two-thirds of its revenue from T&D, and it owns about twice Kalpataru's tower-making capacity. The rest of the page explains how each got here.
How the Two Business Models Differ
Kalpataru Projects: a grid builder that also builds buildings
Kalpataru started as a tower and transmission company in 1981 and became Kalpataru Projects International after merging its building subsidiary, JMC Projects, in 2023. Power T&D is still its largest business, at ₹12,501 Cr or about 46% of FY26 revenue, up 25% in the year. Buildings and factories brought in ₹6,958 Cr, oil and gas ₹2,723 Cr and water ₹2,112 Cr.
Its towers come from two plants at Gandhinagar and Raipur with 2,40,000 MT of yearly capacity, and it has built more than 38,000 km of transmission lines. Abroad, it owns about 65.9% of Linjemontage, a Swedish company that works on substations and networks up to 400 kV in Sweden and Norway. Linjemontage listed in September 2026, and Kalpataru received about ₹650 Cr from that share sale.
The order book shows how spread out it is. Of ₹71,846 Cr at 30 September 2026, T&D was 41% (₹29,389 Cr) and buildings and factories 30% (₹21,659 Cr), with oil and gas at ₹8,196 Cr, water at ₹6,702 Cr and infrastructure at ₹5,900 Cr. About 62% of the book is in India.
KEC International: a power company first, with its own factories
KEC is the flagship infrastructure company of the RPG group, with eight decades of experience. Power T&D made 68% of its FY26 revenue, up from 59% a year earlier, with T&D revenue of ₹15,883 Cr, up 24%. The rest came from civil works (₹3,823 Cr), cables and conductors (₹2,217 Cr), transportation (₹1,555 Cr), and smaller renewables and pipeline businesses.
Manufacturing is KEC's biggest difference. It has six tower plants, three in India and one each in Dubai, Mexico and Brazil, with 4,83,800 MT a year of capacity for towers, poles, hardware and structures. Its US subsidiary SAE Towers sells towers and poles across the Americas. A separate subsidiary, KEC Asian Cables, makes power cables up to 220 kV and overhead conductors at Vadodara and Mysuru. KEC can build lines up to 1,200 kV and substations up to 1,150 kV.
So the two make money in different ways. Kalpataru earns mostly as a contractor across several kinds of projects. KEC adds product margins from towers, cables and conductors sold to others, but its civil and transportation arms have been slower to deliver.
Latest Quarter: Q2 FY27 Side by Side
Both companies reported the July to September 2026 quarter in early November 2026: KEC on 2 November and Kalpataru on 5 November.
| Q2 FY27 (consolidated, ₹ Cr) | Kalpataru Projects | KEC International |
|---|---|---|
| Revenue | 7,004 (Q2 FY26: 6,529), up 7% | 5,468 (Q2 FY26: 6,092), down 10% |
| EBITDA and margin | Core EBITDA 581, 8.3% (8.6% a year earlier) | 271, 5.0% (7.1% a year earlier) |
| Finance cost | 90 (136 a year earlier), about 1.3% of revenue | 191 (171 a year earlier), 3.5% of revenue |
| Profit before tax and margin | 398, up 24%; 5.7% | 41, down 81%; 0.7% |
| Profit after tax | 292, up 23% | 30, down 82% |
| H1 FY27 revenue | 13,412, up 6% | 10,491, down 6% |
| H1 FY27 profit after tax | 603, up 34% | 102, down 64% |
Kalpataru's reported growth looks slower than it is, because it is winding down road assets and a Brazilian subsidiary. Excluding those, revenue rose 13% to ₹6,995 Cr. Its margin gain came from interest: finance cost fell from ₹136 Cr to ₹90 Cr as debt came down, which lifted the profit before tax margin from 4.9% to 5.7%.
KEC's quarter went the other way. T&D revenue fell 10% to ₹3,686 Cr, with KEC's own T&D work down 13% even as SAE Towers grew 15%. Transportation fell 47% to ₹224 Cr and renewables to ₹13 Cr from ₹190 Cr. Cables and conductors was the bright spot, up 17% to ₹613 Cr. KEC said supply chain disruptions in the Middle East, right-of-way and land problems in India T&D, and slower supplies on some projects because of high global costs held back the quarter. Revenue was still 9% higher than in Q1 FY27.
Five-Year Financials: FY22 to FY26
Both companies grew revenue strongly over five years, but their profits followed very different paths.
| Year | Kalpataru revenue (₹ Cr) | KEC revenue (₹ Cr) | Kalpataru EBITDA margin | KEC EBITDA margin | Kalpataru PAT (₹ Cr) | KEC PAT (₹ Cr) |
|---|---|---|---|---|---|---|
| FY22 | 14,777 | 13,742 | 8.6% | 6.6% | 535 | 332 |
| FY23 | 16,361 | 17,282 | 8.4% | 4.8% | 435 | 176 |
| FY24 | 19,626 | 19,914 | 8.3% | 6.1% | 516 | 347 |
| FY25 | 22,316 | 21,847 | 8.2% | 6.9% | 567 | 571 |
| FY26 | 27,143 | 23,506 | 8.3% | 7.1% | 1,031 | 606 |
Kalpataru's revenue grew 1.8 times in these five years and KEC's 1.7 times. KEC was actually the larger of the two in FY23 and FY24, but Kalpataru pulled ahead in FY26 with 22% growth against KEC's 8%.
Margins tell the bigger story. Kalpataru's EBITDA margin has stayed in a narrow band of 8.2% to 8.6%. KEC's fell from 6.6% in FY22 to 4.8% in FY23, when much higher commodity prices and logistics costs hit its projects, and it has climbed back only slowly to 7.1%. Interest also takes a much larger bite at KEC: its FY26 interest cost of ₹664 Cr was about 40% of its EBITDA.

Order Book and Growth Plans
Kalpataru Projects
Kalpataru's order book reached a record ₹71,846 Cr at 30 September 2026, up 11% in a year and about 2.6 times its FY26 revenue. It has won ₹23,934 Cr of new orders in FY27 so far, and is L1 (lowest bidder) or favourably placed in about ₹5,000 Cr more. In T&D alone it won ₹10,122 Cr of orders.
Management raised its FY27 order inflow guidance from ₹30,000 Cr to ₹35,000-36,000 Cr, kept its target of 15% revenue growth (about ₹28,000-30,000 Cr of revenue), and said revenue of about ₹50,000 Cr in three to four years would not be a challenge. It sees India's T&D market at ₹1 trillion to ₹1.25 trillion a year for at least five years, with one to two HVDC projects a year on top, and expected to submit ₹15,000-20,000 Cr of T&D bids in the two months after its November call.
KEC International
KEC's order book was ₹39,946 Cr at 30 September 2026, its highest ever, against ₹39,325 Cr a year earlier. Including L1 positions, it reaches about ₹43,500 Cr, or about 1.7 times FY26 revenue on the order book alone. It booked ₹13,528 Cr of orders in FY27 so far, about 70% of them in T&D, after ₹25,280 Cr in FY26.
KEC's strongest card is the pipeline: it has tenders worth over ₹2,00,000 Cr under evaluation or coming up, more than half of them in T&D. In Q2 FY27 it won or was L1 on over ₹3,000 Cr of PGCIL work, including its largest-ever India T&D order from PGCIL, and its T&D order book plus L1 is over ₹28,000 Cr. It is also adding capacity: a second phase of its aluminium conductor plant is under way, and new elastomeric cable lines should start production in Q3 FY27.
In August 2026, KEC said FY27 revenue growth of 12% to 15% was still feasible. After a first half that fell 6%, that is a steep climb. On our arithmetic, KEC would need ₹15,836 Cr to ₹16,541 Cr of revenue in the second half, which is 28% to 33% more than the ₹12,392 Cr it made in the second half of FY26.

Balance Sheet and Cash Flow
This is where the gap between the two is widest.
| Measure | Kalpataru Projects | KEC International |
|---|---|---|
| Net debt, 30 Sep 2025 | ₹3,169 Cr | ₹4,615 Cr |
| Net debt, 30 Sep 2026 | ₹72 Cr | ₹5,614 Cr |
| Net working capital, 30 Sep 2026 | 68 days | 155 days |
| Net worth, March 2026 | ₹7,777 Cr | ₹6,160 Cr |
| Operating cash flow, FY22-FY26 total | ₹4,661 Cr | ₹646 Cr |
| Profit after tax, FY22-FY26 total | ₹3,084 Cr | ₹2,032 Cr |
| Cash flow to profit, five years | 1.5 times | about 0.3 times |
Kalpataru cut its net debt by ₹3,097 Cr in a year. Part of that came from about ₹650 Cr raised by the Linjemontage listing, but most came from collecting cash faster: net working capital fell from 90 days to 68 days. Over five years it turned 1.5 times its profit into operating cash. Its credit rating was raised to AA+ by CRISIL and India Ratings. It is spending more on equipment, with capex expected above ₹1,000 Cr in FY27, and it has said debt could rise again with working capital and capex payments.
KEC's operating cash flow was negative in FY26 at minus ₹414 Cr, and over five years it turned only about 0.3 times its profit into cash. Its money is tied up in projects: net working capital was 137 days in March 2026 and 155 days in September 2026. Net debt rose by ₹999 Cr in a year to ₹5,614 Cr, and to ₹7,793 Cr including interest-bearing acceptances. KEC said about ₹600 Cr of collections, mostly in the Middle East and Afghanistan, slipped from September and came in during October 2026, and that it expects net debt to come down to about ₹6,000 Cr by the end of FY27. Its target for net working capital at the end of FY27 is 110 days.
| Operating cash flow (₹ Cr) | FY22 | FY23 | FY24 | FY25 | FY26 |
|---|---|---|---|---|---|
| Kalpataru Projects | 714 | 656 | 843 | 914 | 1,534 |
| KEC International | -284 | 614 | 311 | 419 | -414 |
For readers new to these terms, our guides on the cash flow statement and the debt to equity ratio explain why cash collection matters so much for EPC companies.
Risks for Each Company
Kalpataru Projects
- Middle East costs. About 14% of its order book is in the Middle East, where it faces supply chain problems and higher freight costs.
- Water-scheme dues. It has about ₹1,500 Cr of receivables on water projects, and about two-thirds of that is overdue, though it collected about ₹1,100 Cr up to October 2026.
- Fixed prices. Only about half of its order book is variable priced, so a sharp rise in steel or other costs could squeeze the rest.
- Debt could rise again. Capex above ₹1,000 Cr this year and higher working capital could push net debt up from today's very low level.
- Many businesses at once. With buildings, pipelines, water and urban infrastructure alongside T&D, execution has to go right in many places together.
KEC International
- Middle East exposure. The region was about 25% of its order book and L1 in August 2026, and supply disruptions there hurt the September quarter.
- Working capital and debt. At 155 days of net working capital and ₹5,614 Cr of net debt, interest already takes 3.5% of revenue.
- Slow collections. It was owed about ₹300 Cr in Afghanistan in August 2026, and water and metro payments came in slower than expected.
- Right of way in India. Land and right-of-way delays slowed India T&D work in the quarter.
- Guidance gap. Meeting 12% to 15% growth for FY27 now needs a second half 28% to 33% larger than a year earlier.
Which Is Stronger on Each Measure?
There is no single winner. Each company is stronger on different measures, and the table below shows which one leads on each, using the figures above.
| Measure | Kalpataru Projects | KEC International | Stronger on this measure |
|---|---|---|---|
| FY26 revenue | ₹27,143 Cr | ₹23,506 Cr | Kalpataru |
| FY26 revenue growth | 22% | 8% | Kalpataru |
| Q2 FY27 revenue growth | +7% (+13% comparable) | -10% | Kalpataru |
| FY26 EBITDA margin | 8.3% | 7.1% | Kalpataru |
| Q2 FY27 PBT margin | 5.7% | 0.7% | Kalpataru |
| Order book, 30 Sep 2026 | ₹71,846 Cr, about 2.6 times revenue | ₹39,946 Cr, about 1.7 times revenue | Kalpataru |
| Net debt, 30 Sep 2026 | ₹72 Cr | ₹5,614 Cr | Kalpataru |
| Net working capital | 68 days | 155 days | Kalpataru |
| Cash flow to profit, five years | 1.5 times | about 0.3 times | Kalpataru |
| Focus on power T&D | About 46% of FY26 revenue | 68% of FY26 revenue | KEC |
| Tower-making capacity | 2,40,000 MT a year | 4,83,800 MT a year | KEC |
| Own cables and conductors | No | Yes, Vadodara and Mysuru | KEC |
| Countries served | 75+ | 110+ (including supply) | KEC |
| Tender pipeline disclosed | ₹15,000-20,000 Cr of T&D bids due within two months | Over ₹2,00,000 Cr of tenders | Not comparable |
On these numbers, Kalpataru is stronger on size, growth, margins, order book and balance sheet today. KEC is stronger on focus on power transmission, manufacturing depth and global reach.
Explore our Products
Research Framework

Emerging Titans
Combination of quantitative analysis, industry tailwinds, and management assessment - SPRINT investment philosophy

Tiny Titans
Heavy emphasis on scuttlebutt research, plant visits, and early on-ground signals
Read our full company report: KEC International: Record Orders, Weak Margin, High Debt.
Conclusion
Kalpataru Projects and KEC International sit in the same part of the power chain but are in very different shape in November 2026. Kalpataru has turned a large, spread-out order book into steady margins and strong cash flow, and has almost no net debt left. Its main questions are whether it can keep that discipline across many businesses at once, and how its Middle East work and water receivables play out.
KEC is the purer power company. It has twice the tower capacity, its own cables and conductors, and a tender pipeline of over ₹2,00,000 Cr. But its profits have been squeezed by the Middle East, right-of-way delays and slow-moving civil and transport work, and its working capital and debt are much higher. What it needs to show is a strong second half, collections that bring net debt toward its own target, and margins that move back up.
Which of the two fits an investor's research depends on what they are looking for: a diversified EPC company with a strong balance sheet, or a T&D-focused company with deep manufacturing that is working through a difficult year. The next two quarters will show whether KEC's recovery arrives and whether Kalpataru's margins hold. A deeper look at Kalpataru Projects' order book and net debt covers it in more depth, and the lists of top power sector stocks in India and high order book stocks in India show where both sit among their peers.
FAQs
Kalpataru Projects vs KEC International: which is better?
+Neither is better on every measure. Kalpataru Projects is stronger on FY26 revenue (₹27,143 Cr against ₹23,506 Cr), EBITDA margin (8.3% against 7.1%), order book (₹71,846 Cr against ₹39,946 Cr at 30 September 2026) and net debt (₹72 Cr against ₹5,614 Cr). KEC International is stronger on its focus on power transmission, tower-making capacity and its own cables and conductors business.
Which company has the bigger order book, Kalpataru or KEC?
+Kalpataru Projects had an order book of ₹71,846 Cr at 30 September 2026, about 2.6 times its FY26 revenue. KEC International had ₹39,946 Cr, or about ₹43,500 Cr including L1 positions, about 1.7 times its FY26 revenue on the order book alone.
Why did KEC International's profit fall in Q2 FY27?
+KEC's Q2 FY27 profit after tax fell 82% to ₹30 Cr as revenue fell 10% to ₹5,468 Cr. The company said supply chain disruptions in the Middle East, right-of-way and land problems in India T&D, and slower supplies on some projects because of high global costs held back work, while interest rose to 3.5% of revenue.
How much debt do Kalpataru Projects and KEC International have?
+At 30 September 2026, Kalpataru Projects had net debt of ₹72 Cr, down from ₹3,169 Cr a year earlier. KEC International had net debt of ₹5,614 Cr, or ₹7,793 Cr including interest-bearing acceptances, and expects its net debt to come down to about ₹6,000 Cr by the end of FY27.
What does each company make in its own factories?
+Kalpataru Projects makes transmission towers at Gandhinagar and Raipur, with 2,40,000 MT of yearly capacity. KEC International has six tower plants in India, Dubai, Mexico and Brazil with 4,83,800 MT a year of capacity, and makes cables and conductors at Vadodara and Mysuru.
Which businesses besides power transmission do the two companies run?
+Kalpataru Projects also builds buildings and factories, oil and gas pipelines, water schemes, railways and urban infrastructure, and owns most of Linjemontage in Sweden. KEC International also runs civil, railways and metros, renewables and oil and gas pipeline businesses, and sells cables and conductors.

High growth stock specialist, Value Educator
Shashank Mahajan is an equity research professional with over 12 years of experience in identifying high-potential SME and micro-cap stocks at an early stage. He follows a rigorous scuttlebutt research–driven approach, combining on-ground insights with deep financial analysis. Shashank specializes in uncovering under-researched and under-owned companies with strong management quality and long-term growth potential. Through disciplined research and early identification, he focuses on spotting tomorrow’s market leaders before they enter the mainstream investor radar.
More about Shashank Mahajan →
PCBL Chemical: Carbon Black Margins and Battery Materials
KEC International: Record Orders, Weak Margin, High Debt

Sona BLW: EV Revenue Now Tops Half of Its Auto Sales
HPL Electric & Power: Smart Meters, Wires and Two Engines
Kaynes Technology: EMS, Chip Plants and ₹10,563.5 Cr Orders
Sterlite Technologies: Glass Rods to Hyperscaler Deals
Explore our Products
Research Framework
Emerging Titans
Combination of quantitative analysis, industry tailwinds, and management assessment - SPRINT investment philosophy
Tiny Titans
Heavy emphasis on scuttlebutt research, plant visits, and early on-ground signals



India's Aerospace Opportunity
Global Demand. Supply Bottlenecks. Opportunities Ahead.
Don't Miss This Exclusive Webinar!
Join Value Educator to decode the key trends shaping India's aerospace sector and learn how to identify tomorrow's potential leaders in the space.
- How the aircraft value chain works, layer by layer
- Indian companies supplying global aircraft makers
- A framework to judge any aerospace company

 Orders
 Subscription
 Share with friends


Required Details
₹23999.00
(12 month subscription)
As per SEBI regulations, all users are mandated to complete the KYC that is validated for 1 year. Post payment, you will be redirected to the KYC screen


No comments yet. Be the first to comment!