
K P Energy: Wind Farm Builder With a 1.64 GW Order Book

A wind turbine is the part of a wind farm that everyone sees. But before a single blade turns, someone has to find a windy site and buy or lease the land. Someone has to build a road to every tower, test the soil, pour a foundation for a tower that can stand 120 to 160 metres tall, and run cables and power lines from every turbine to the grid.
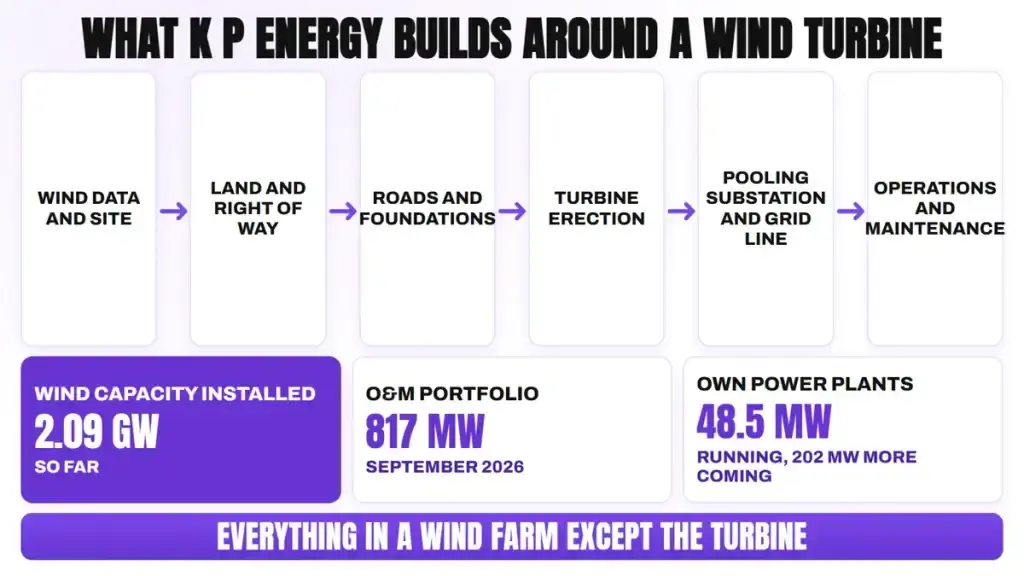
All of that work around the turbine is called balance of plant, or BoP. It means every part of a wind farm except the turbine itself: the land, the roads, the foundations, the internal cables, the substation and the line to the grid. In a wind farm the turbines are spread across many separate spots, often on farmers' fields, so this work is spread out too.
Each of those spots needs right of way. Right of way, or ROW, means the legal permission to put a tower or run a power line across someone else's land, and it usually means paying the landowner. A pooling substation is the point where the power from many turbines is collected and stepped up to a high voltage before it goes into the grid.
That work is the business of K P Energy Ltd (NSE: KPEL), a company from Surat in Gujarat. It started with balance of plant and now wants to be a full EPC contractor for wind farms. EPC stands for engineering, procurement and construction, which means the contractor designs the project, buys the equipment and builds it, handing over a finished plant. It also owns a few wind and solar plants as an independent power producer, which means a company that owns power plants and sells the electricity. K P Energy says it has installed 2.09 GW of wind capacity so far, and it looks after 817 MW of wind farms through its O&M business.
Now let's look at how fast that business has grown. In FY22 its revenue was ₹250.4 Cr. By FY26 it was ₹1,497.1 Cr, about 6 times higher, and in the first half of FY27 alone it was ₹1,058.1 Cr. But in the same half year its profit fell, and its EBITDA margin dropped to about half of what it was a year earlier.
K P Energy in five numbers
- H1 FY27 revenue of ₹1,058.1 Cr, up 103.4%
- Q2 FY27 EBITDA margin of 12.1%, against 22.6% a year ago
- Q2 FY27 profit after tax of ₹27.1 Cr, down 24.6%
- An order book of 1.64 GW, about ₹1,940 Cr, in September 2026
- Inventory of ₹1,333.5 Cr in March 2026, down to ₹1,069.9 Cr in September
So the business is now far larger than it was two years ago, and it earns much less on each rupee of it. How did that show up in the latest numbers? Let's first understand the company, and then look at the latest quarter.
K P Energy: Company Overview
K P Energy Ltd was incorporated in 2010 and is based in Surat, Gujarat, as the KP Group's company for wind energy infrastructure. Dr Faruk G Patel, who founded the KP Group in 1994, is its Managing Director, and Affan Patel is a whole-time director. The company builds the balance of plant for wind and wind-solar hybrid farms, from wind data, land and right of way to roads, foundations, turbine erection, pooling substations and grid lines, and is moving towards full EPC contracts. It also owns 48.5 MW of wind and solar plants and runs an O&M business with an 817 MW portfolio. It listed on the BSE SME platform in 2016, moved to the BSE main board in 2018 and listed on the NSE in November 2024. It had 350 permanent employees in March 2026. Revenue from operations was ₹1,497.1 Cr in FY26, and in September 2026 it had borrowings of ₹454.9 Cr against total equity of ₹580.5 Cr, with a CARE A- rating. Read this Suzlon: How It Reclaimed India's Wind Market
"Know what you own, and know why you own it."
— Peter Lynch
K P Energy does not make turbines. It builds everything around them, and most of that work has been for its own sister company. Knowing that is the first step to reading its numbers.
The Quarter Revenue Rose 79.1% and Profit Fell
Let's look at Q2 FY27, the July to September quarter that K P Energy reported on 13 November 2026. Revenue from operations was ₹538.7 Cr, up 79.1% from ₹300.8 Cr a year ago, and 3.7% higher than the ₹519.5 Cr of Q1 FY27. That came in the monsoon quarter, when work at wind sites usually slows down.

As we can see, the growth came from one line. Infrastructure development, the EPC and balance of plant work, brought in ₹527.1 Cr, against ₹289.0 Cr a year ago. Sale of power from the company's own plants was ₹8.4 Cr, and O&M brought in ₹3.2 Cr.
That growth did not reach profit. EBITDA was ₹65.2 Cr, lower than the ₹68.6 Cr of a year ago, even though revenue rose 79.1%. The EBITDA margin, measured on total income including other income, fell to 12.1% from 22.6%. Read this EBITDA Explained: Uses and Limits Profit after tax fell 24.6% to ₹27.1 Cr.

That chart shows when the change came. The margin was about 22.1% in Q3 FY26 and about 21.0% in Q4 FY26. Then it dropped to 11.9% in Q1 FY27 and stayed there at 12.1% in Q2. The fall starts at the gross margin, the share of revenue left after the cost of materials, which went from 30.0% to 18.6% in a year.
That fall in the margin has several causes, management says, and you can see most of them on the ground. Farmer protests across Gujarat led the government to revise the right of way rates paid to landowners, so the company pays more to place each tower and line. Labour costs swing, and when a right of way dispute stops work at one location, the workers and cranes sit idle. Steel prices have been volatile, and some contracts include turbines, which the company supplies at only a small markup.
Those costs hit the margin directly because of how the contracts are priced. Management explained in August 2026 that wind EPC contracts in India are firm, fixed-price contracts for a set scope, timeline and specification. The contracts it is now executing carry no cost-plus clause, so when right of way, labour or steel costs rise after the price is fixed, the company absorbs most of the rise until it bids for new work at new prices.
That also explains why the margin stays low for a while. The projects in today's order book were priced before these costs went up, and they will take several quarters to finish. New orders priced on the higher costs would come in only after the tenders now under bid are decided.
Management also says we should not expect this to change quickly. The group CFO said in November 2026 that the company will have to live with these margins for at least the next 2 to 4 quarters.
That same pattern shows in the first half. H1 FY27 revenue was ₹1,058.1 Cr, up 103.4% from ₹520.3 Cr, and about 71% of the ₹1,497.1 Cr the company made in all of FY26. But profit after tax for the half was ₹53.2 Cr, against ₹61.4 Cr a year ago.
Beyond the margin, interest costs grew faster than the business. Finance cost was ₹17.1 Cr in the quarter, against ₹9.0 Cr a year ago. Total borrowings were ₹454.9 Cr in September 2026, against ₹422.0 Cr in March, and the debt to equity ratio was 0.78.
What the ₹1,333.5 Cr of Inventory Is
Now let's look at the inventory, because that debt is linked to this one line on the balance sheet. In March 2026 K P Energy held inventory of ₹1,333.5 Cr, against ₹228.2 Cr a year earlier. That was about 49.6% of its total assets. Read this Inventory Turnover Ratio Explained
That inventory includes the cost of land and related development expenses. Management said in May 2026 that the company was carrying an inventory of wind turbine generators, the turbines, for projects it had already won. It said it stocked up because the geopolitical situation made supply harder, and that it did not want to fall behind on delivery.

That stock cost cash. In FY26 the rise in inventory used about ₹1,105.3 Cr of operating cash flow, and operating cash flow fell to ₹122.6 Cr from ₹161.7 Cr, even as profit after tax rose to ₹181.4 Cr. Management said the inventory will turn into receivables and then into cash as projects are delivered.
That has started. By September 2026 inventory was down to ₹1,069.9 Cr, and the fall released about ₹263.6 Cr in the first half. Operating cash flow for H1 FY27 was ₹66.4 Cr. Read this Cash Flow Statement Explained Management said in November 2026 that it does not expect inventory to rise much from here, and that the trend will be down.
The Order Book Has Been Shrinking
Now let's look at the orders, because they show how much of the coming revenue is already booked. At the end of September 2026 the order book was about 1.64 GW, worth about ₹1,940 Cr. In June 2026 it was 2.16 GW, about ₹2,250 Cr, and in March 2026 it was about ₹3,000 Cr.
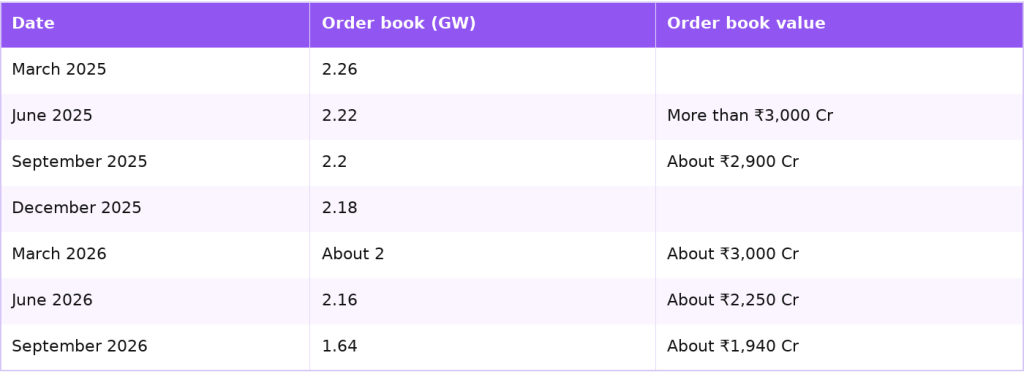
So the book fell by about ₹1,060 Cr in six months, roughly the ₹1,058.1 Cr of revenue the company booked in the same half. Few new orders came in to replace it. In the last quarter of FY26 the company added three orders of more than 230 MW, worth more than ₹730 Cr, and in August 2026 management said it was picking new orders selectively and expected new ones in about 6 to 9 months.
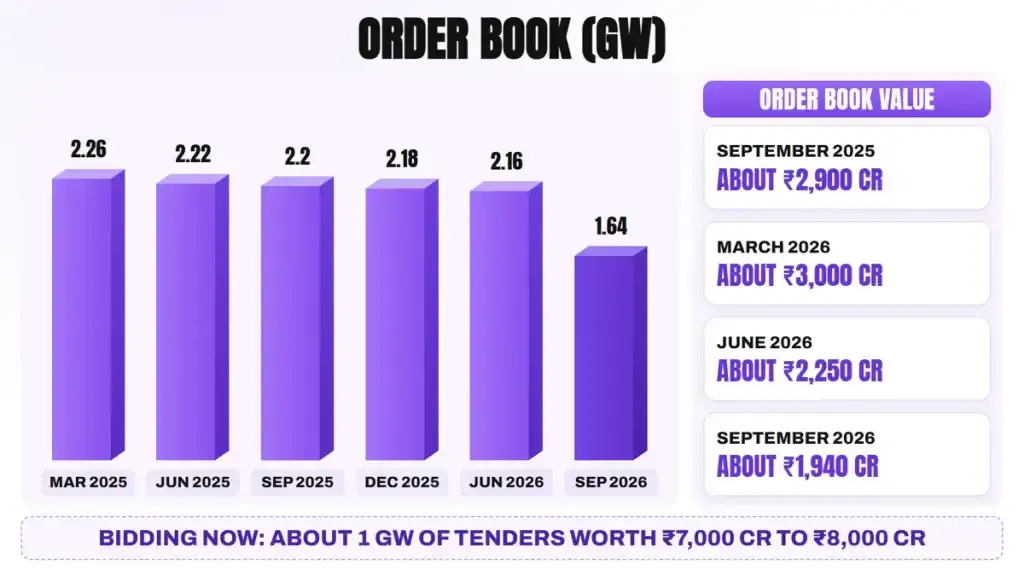
What the order book says: at the first-half pace of revenue, the ₹1,940 Cr book covers about 11 months of work. It is enough for the FY27 guidance, but FY28 depends on new orders.
That is why the next tenders matter. In November 2026 management said it is bidding for almost 1 GW of tenders worth about ₹7,000 Cr to ₹8,000 Cr, with results expected in 3 to 6 months. It hopes to win about 70% of them, or about 700 MW.
That tender value also shows a change in what the company sells. The current book works out to about ₹1.2 Cr per megawatt, while the tenders it is bidding for are worth about ₹7 Cr to ₹8 Cr per megawatt. Management describes this as the step from a balance of plant contractor to a full EPC partner, where the scope can include the turbine.
How a Surat Wind Contractor Grew Up With the KP Group
Now that we have seen the quarter, let's go back to where the company came from. K P Energy was incorporated in 2010 as the KP Group's company for wind energy infrastructure. The group was founded in 1994 by Dr Faruk G Patel, who is K P Energy's Managing Director, and it is based in Surat.
For most of its life, as you might expect from its address, the company has been a Gujarat business. Gujarat has more than 17 GW of installed wind capacity, the most of any state, and most of K P Energy's work has been there. It listed on the BSE SME platform in February 2016, at a valuation of ₹24 Cr, moved to the BSE main board in May 2018 and listed on the NSE in November 2024.

That table shows two stages. From FY22 to FY24, revenue grew and the margin rose from 14.7% to 20.3%. Then in FY25 and FY26 revenue jumped as the group's own projects grew, and the margin held above 20%. FY26 revenue grew 59.4%, and the EBITDA margin reached 21.8%, its best in these five years.
That growth came mostly from one customer. In FY26 K P Energy sold ₹1,057.8 Cr of goods and services to KPI Green Energy, its sister company in the KP Group. That was about 70.7% of its revenue, against about 43.2% in FY25. KPI Green builds and owns solar, wind and hybrid power plants, and it gives the wind part of that work to K P Energy.

That share has started to move in the latest quarters. Management says group companies were 80% to 85% of revenue in Q1 FY27 and about half in Q2 FY27.
"Show me the incentive and I will show you the outcome."
— Charlie Munger
When one group company builds the plants that another group company owns, the price of each contract matters to both sets of shareholders. That is why the share of group revenue is worth watching every quarter. That same month, the group also answered some of the questions investors had raised. It moved the audit of all three listed group companies to MSKC & Associates, a member of the BDO network, for five years from FY27, and K P Energy's results for Q2 FY27 were the first reviewed by the new auditor. It also proposed a cap on the royalty the companies pay the promoter, and added directors to the board.
In September 2026 the group also set out who does what: K P Energy will be its dedicated wind EPC company, including the wind part of every hybrid project, while KPI Green Energy focuses on owning power plants.
"See, we don't have any concept of group company in KP Group. All companies are associate of each other." - Kapil Kriplani, Group Chief Financial Officer, November 2026
Three Business Lines Around the Wind Farm
Now let's split the business into its parts, because each one earns money in a different way. K P Energy reports three lines: infrastructure development (the EPC and balance of plant work), sale of power from its own plants, and operations and maintenance.

These lines are very different in size, as you can see. Almost all the revenue comes from building wind farms for others. The two smaller lines are small today, but they earn more on each rupee.
EPC and Balance of Plant, the Main Business
Let's start with the main business. K P Energy's work covers six stages: measuring the wind and choosing the site, preparing the site and getting right of way, building foundations and erecting the turbines, building pooling substations and high-voltage lines, getting permits, and running the plant afterwards. It has installed more than 45 wind masts to measure wind speed, and it uses LiDAR, a laser-based instrument, to study sites.
Its customers include KPI Green Energy and several outside buyers. In 2024 it won a 464.10 MW balance of system package for a wind project of NTPC Renewable Energy and IndianOil NTPC Green Energy, and 368.55 MW of work from Aditya Birla Group companies. In FY26 it also won a 99 MW EPC project from Inox Renewable Solutions, a 40.8 MW hybrid project from Enerparc Energy and a 91.4 MW hybrid project from JK Paper.
That work is moving to larger turbines. The company says it was the first in India to install a 'Make in India' 4.2 MW turbine, in South Gujarat, and it has a 5.3 MW turbine under installation. Management says larger turbines of 4 MW to 5 MW produce more power from the same land.
Its Own Power Plants
Next, let's look at the power plants it owns, the independent power producer or IPP business. As we saw, an IPP owns power plants and sells the electricity, usually under long contracts with a utility. K P Energy had 48.5 MW of its own plants running in September 2026, of which 37 MW is wind and 11.5 MW is solar.
That portfolio is set to grow about five times. The company is building two more wind projects of 100 MW each: one under a SECI tender at ₹3.67 per unit, and one for GUVNL at ₹3.44 and ₹3.43 per unit. Each has a 24-month build time from its power purchase agreement. Management said in August 2026 that these two projects should add about ₹200 Cr to IPP revenue once they run.
The reason it wants these plants, as we will see, is margin. Management said in 2025 that an EPC contract usually carries a gross margin of 15% to 18%, while power sale carries 65% to 75%. The plants generated 5.92 crore units of power in H1 FY27, and management says it has no large IPP plans beyond these 202 MW.
These plants also help in another way. Power plants are depreciated over their life, and that depreciation lowers taxable profit while the cash keeps coming in. Management says the depreciation benefit from the new capacity will support the company's cash profit, and the power sale income does not depend on winning the next construction tender.
Operations and Maintenance
Finally, let's look at operations and maintenance, or O&M, which keeps a wind farm's balance of plant working after it is built. K P Energy does this through its subsidiary KP Energy OMS Limited, and its O&M portfolio was 817 MW in September 2026. O&M revenue was ₹3.2 Cr in Q2 FY27, against ₹1.7 Cr a year ago. It is still a very small part of the business, but it grows with every wind farm the company builds.
Where K P Energy Sits in the Wind Value Chain
Now let's place K P Energy in the wider wind chain. Turbine makers build and supply the turbines, towers and blades. Developers and power producers, such as KPI Green Energy, NTPC Green Energy and the Aditya Birla Group, own the wind farms and sell the power. K P Energy sits between them: it turns a turbine order into a working wind farm connected to the grid.

That chain is growing fast in India. The country added a record 6.05 GW of wind capacity in FY26, and another 3 GW in the first half of FY27. Cumulative wind capacity has crossed 59 GW, against a government target of 100 GW by 2030. To get there, India has to add about 10 GW a year, against about 6 GW in its best year so far, and about 40 GW of wind projects are under construction.
Those projects need more balance of plant work than before. Management points out that India's turbine factories can now make about 24 GW a year, roughly three times what the country will install this year. So the turbines are no longer the bottleneck. Land, right of way, civil and electrical works and grid lines are, and that is K P Energy's part of the job.
That part of the job is harder in wind than in solar. A solar park sits on one block of land, while a wind farm needs towers at the exact spots where the wind is strongest, spread across many fields. So each wind project means many separate land deals and right of way agreements, and management says this is where the right of way problem is much larger for wind.
Beyond new wind farms, two newer areas could add work later. Hybrid and round-the-clock power projects combine wind, solar and storage, so each project needs a larger EPC scope. And the company's deck says about 25 GW of old wind turbines below 2 MW could be replaced with larger ones, which is called repowering.
The group also helps K P Energy here. KP Green Engineering, a sister company, makes lattice and tubular towers and power-line structures, so K P Energy can source parts of its supply within the group. In FY26 K P Energy also received an inter-state electricity trading licence from the power regulator, CERC, which lets it sell power across India.
Why K P Energy's Moat Is Hard to Copy
Now that we have seen the parts, let's understand the moat. Any civil contractor can pour concrete. So the question is why a wind developer should hire K P Energy, and not a general builder, to put up its wind farm.
One part of the moat is land and grid access. A wind farm needs sites with strong wind, land at each tower and a connection to the grid. The company says it has secured evacuation rights to the state and central grid, and a land bank that speeds up projects. In a state where right of way has become harder and costlier, having land and grid rights ready makes a project faster to start.
Another layer is experience on the ground. K P Energy has more than 15 years of wind work, mostly in Gujarat, and the annual report calls it the number one balance of plant provider for wind and hybrid projects in Gujarat. Each wind site has different soil, different landowners and different access roads, and that know-how comes only from building many of them. Management says there are not many competitors in wind EPC in India.
"In business, I look for economic castles protected by unbreachable moats."
— Warren Buffett
K P Energy's castle is its land, grid access and site experience in Gujarat. The margin in the coming quarters will show how wide that moat really is.
Beyond the site work, the group adds a third layer. Towers and support structures come from KP Green Engineering, and a network operations centre run by the group watches the group's plants in real time. That gives K P Energy more control over cost and timing than a contractor that buys everything outside.
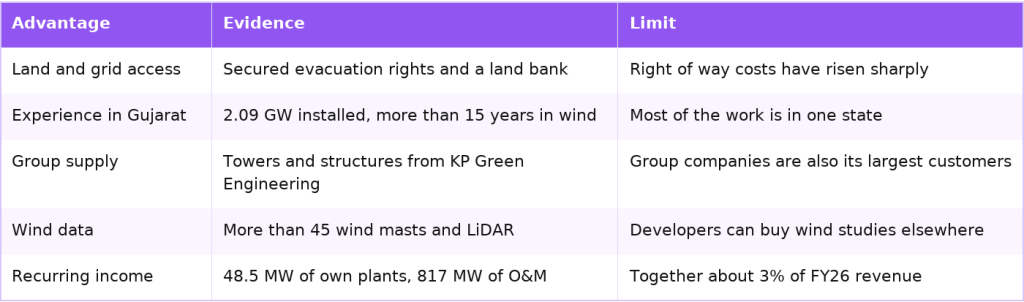
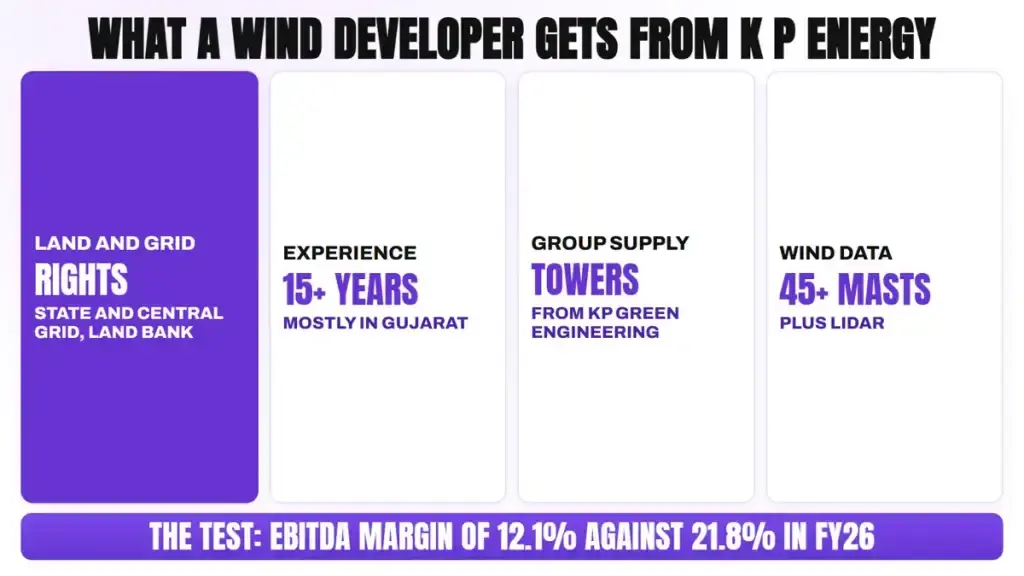
That table shows us why the margin is the real test of the moat. If developers value K P Energy's land, grid rights and experience, it should be able to pass higher costs on to them. In FY26 it did, with a 21.8% EBITDA margin. In the last two quarters it could not, and the margin fell to about 12%.
Financials: Five Years of Revenue, Margins and Cash Flow
One quarter can mislead in a contracting business, so let's look at the full years together. EBITDA here is profit before tax plus finance cost and depreciation, so it includes other income, and the margin is on total income, as the company's own decks show it.

Revenue grew about 6 times in four years, from ₹250.4 Cr in FY22 to ₹1,497.1 Cr in FY26, and profit after tax grew from ₹18.3 Cr to ₹181.4 Cr. The EBITDA margin rose every year in this period, from 14.7% to 21.8%, before it dropped to about 12% in the first two quarters of FY27.
Cash flow has broadly followed profit, with one large gap. From FY22 to FY26, operating cash flow added up to about ₹371.4 Cr, against about ₹417.2 Cr of profit after tax, or about 89%. FY25 was strong at ₹161.7 Cr, but in FY26 the rise in inventory used about ₹1,105.3 Cr, and operating cash flow came down to ₹122.6 Cr.
The balance sheet has taken on more debt with that growth. Borrowings were ₹454.9 Cr in September 2026, against ₹422.0 Cr in March, and the debt to equity ratio was 0.78. The group says it will keep debt to equity below 2, even after the two new power plants are built.
"An investment in knowledge pays the best interest."
— Benjamin Franklin
K P Energy's profit and its cash flow tell different stories in FY26. Reading both, and the inventory between them, is what explains the year.
What FY27 Could Look Like on Management's Numbers
So where does the business go from here? In August 2026 management lowered its FY27 revenue growth guidance to 30% to 40%, from the 40% to 50% it gave in May 2026. It said it still aims for 40% to 50% internally, but chose a cautious range because right of way disputes can stop work. On the ₹1,497.1 Cr of FY26, that means FY27 revenue of about ₹1,946 Cr to ₹2,096 Cr.
Now let's put that range against the first half. H1 FY27 revenue was already ₹1,058.1 Cr, so the guidance needs only about ₹888 Cr to ₹1,038 Cr in the second half. That is between about 9.1% less and about 6.2% more than the ₹976.8 Cr of H2 FY26. The ₹1,940 Cr order book covers that comfortably, so the range looks cautious after a half year of 103.4% growth.

On the margin, management gives a clear message. It expects the EBITDA margin to stay around the current level of about 12% for the next 2 to 4 quarters, and says the company will grow profit through volume, not through a higher margin. At about 12% on ₹1,946 Cr to ₹2,096 Cr of revenue, EBITDA would be far below the ₹328.4 Cr of FY26.
Beyond FY27, three other plans matter. The two 100 MW IPP projects should add about ₹200 Cr of revenue once they run. The group says K P Energy's debt to equity will not go above 2, even after these plants. And the result of the 1 GW of tenders, expected in 3 to 6 months, will decide the order book for FY28.
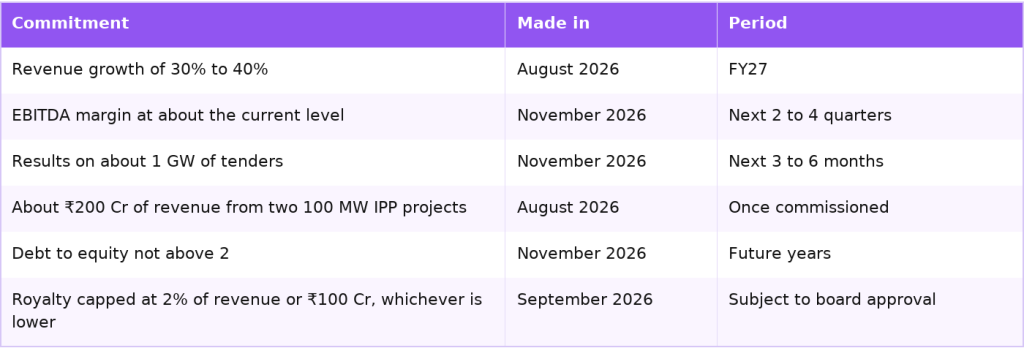
Those commitments are easier to judge against the past. So let's check what management said before against what it delivered.
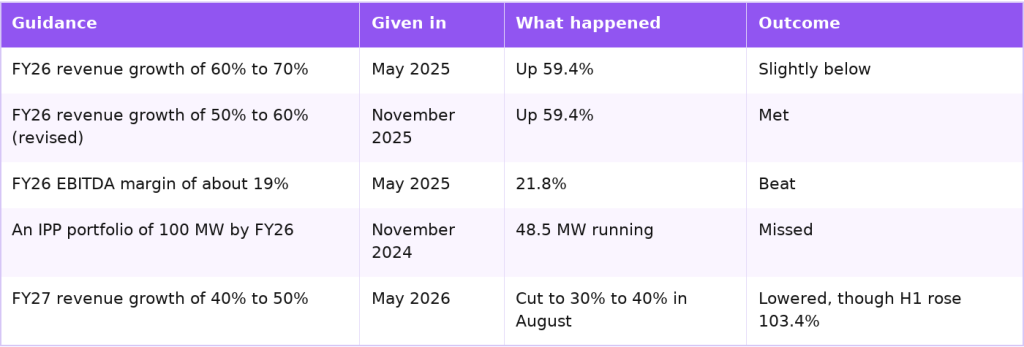
That record shows us a clear pattern. Revenue has broadly come in as guided, and the FY26 margin beat its guide. But the margin came down to about 12% within one quarter of a record FY26, and the IPP plan is running behind its FY26 target. That makes the margin and new orders the numbers to watch from here.
Key Risks
Now let's look at what could go wrong for K P Energy, because the latest half year has already shown some of these risks.
- Lower margins for longer: the EBITDA margin fell to 12.1% in Q2 FY27 from 22.6% a year ago. Management expects it to stay there for 2 to 4 quarters, and higher right of way, labour and steel costs may not reverse.
- Dependence on group companies: about 70.7% of FY26 revenue came from KPI Green Energy. The company says all group contracts are at arm's length, but a change in KPI Green's plans would hit K P Energy directly.
- Royalty to the promoter: K P Energy paid a royalty of ₹29.9 Cr to its Managing Director in FY26, about 2.0% of revenue and about 16.5% of profit after tax. The group plans a cap of 2% or ₹100 Cr, whichever is lower, subject to board approval.
- A shrinking order book: the book fell to 1.64 GW in September 2026 from 2.16 GW in June. If the 1 GW of tenders goes to rivals, FY28 revenue could slow.
- Inventory and cash: inventory was ₹1,069.9 Cr in September 2026, and operating cash flow in FY26 was ₹122.6 Cr against ₹181.4 Cr of profit after tax. If projects slip, more cash stays locked in turbines and land.
- Rising debt cost: borrowings were ₹454.9 Cr and finance cost was ₹17.1 Cr in Q2 FY27, almost double a year ago.
- Right of way and Gujarat: most of the work is in Gujarat, where farmer protests changed right of way rates. A new dispute can halt work at many tower sites together.
- Changing guidance: the FY27 revenue range was cut within three months of being given, and the margin outlook changed in the same period, which makes the next targets harder to rely on.
- Court cases: the annual report lists several public interest litigations and civil applications at the Gujarat High Court, which the company does not expect to have a material effect.
"So it's all culminating into reduced margin, and we have to live with this for at least for next 2 to 4 quarters." - Kapil Kriplani, Group Chief Financial Officer, November 2026
"The essence of investment management is the management of risks, not the management of returns."
— Benjamin Graham
K P Energy's revenue has grown fast. The list below is about the things that could stop that growth from turning into profit and cash.
Explore our Products
Research Framework

Emerging Titans
Combination of quantitative analysis, industry tailwinds, and management assessment - SPRINT investment philosophy

Tiny Titans
Heavy emphasis on scuttlebutt research, plant visits, and early on-ground signals
What to Track Next
If you follow K P Energy, these are the signals that will show where it goes next.
- The EBITDA margin after 12.1%, and whether gross margin moves back above 18.6%
- New orders, and the result of the 1 GW of tenders expected within 3 to 6 months
- The order book after 1.64 GW and about ₹1,940 Cr
- Inventory after ₹1,069.9 Cr, and operating cash flow against profit
- The share of revenue from KPI Green Energy after about half in Q2 FY27
- Progress on the two 100 MW IPP projects and the royalty cap approval
For the other listed solar and wind companies, from glass and cells to turbines and power producers, see Renewable Energy Stocks in India 2026: Solar and Wind.
Conclusion
Let's put it all together. K P Energy has grown from ₹250.4 Cr of revenue in FY22 to ₹1,497.1 Cr in FY26, and it made ₹1,058.1 Cr in the first half of FY27 alone. It does the hardest local part of a wind farm, the land, the right of way, the foundations and the grid line, in the state with India's largest wind fleet. The cautious thread is the margin, which management expects to stay near 12% for 2 to 4 quarters, and the order book, which needs new wins. The next two quarters will show which thread is stronger.
Still, the latest half year shows the other side of that work. What happens next depends on whether the margin recovers from about 12%, whether new orders refill a book that has fallen to 1.64 GW, and whether the business can depend less on its sister company for revenue.
FAQs
What does K P Energy do?
+K P Energy builds the balance of plant for wind and wind-solar hybrid farms in India: the land and right of way, roads, foundations, turbine erection, pooling substations and grid lines. It also owns 48.5 MW of wind and solar plants and runs an O&M business. FY26 revenue from operations was ₹1,497.1 Cr.
How did K P Energy do in Q2 FY27?
+Revenue from operations rose 79.1% to ₹538.7 Cr. But EBITDA was ₹65.2 Cr, against ₹68.6 Cr a year ago, and the EBITDA margin came down to 12.1% from 22.6%. Profit after tax was ₹27.1 Cr, against ₹35.9 Cr.
Why did K P Energy's margin come down?
+Management points to higher right of way payments to landowners after farmer protests in Gujarat, labour and crane idling when work stops, volatile steel prices and contracts that include turbines at a small markup. Its contracts are fixed-price, so it absorbs these costs. It expects the margin to stay near the current level for the next 2 to 4 quarters.
What is K P Energy's inventory?
+Inventory was ₹1,333.5 Cr in March 2026, against ₹228.2 Cr a year earlier. It includes the cost of land and related development expenses, and management says it carried wind turbines bought ahead for projects already won. By September 2026 inventory was down to ₹1,069.9 Cr.
What is K P Energy's order book?
+The order book was about 1.64 GW, worth about ₹1,940 Cr, in September 2026, against 2.16 GW and about ₹2,250 Cr in June 2026. Management says it is bidding for about 1 GW of tenders worth about ₹7,000 Cr to ₹8,000 Cr, with results expected in 3 to 6 months.
How much of K P Energy's business comes from the KP Group?
+In FY26 K P Energy sold ₹1,057.8 Cr of goods and services to its sister company KPI Green Energy, about 70.7% of revenue. Management says group companies were 80% to 85% of revenue in Q1 FY27 and about half in Q2 FY27, and that all group contracts are at arm's length.

High growth stock specialist, Value Educator
Shashank Mahajan is an equity research professional with over 12 years of experience in identifying high-potential SME and micro-cap stocks at an early stage. He follows a rigorous scuttlebutt research–driven approach, combining on-ground insights with deep financial analysis. Shashank specializes in uncovering under-researched and under-owned companies with strong management quality and long-term growth potential. Through disciplined research and early identification, he focuses on spotting tomorrow’s market leaders before they enter the mainstream investor radar.
More about Shashank Mahajan →
PCBL Chemical: Carbon Black Margins and Battery Materials
KEC International: Record Orders, Weak Margin, High Debt

Sona BLW: EV Revenue Now Tops Half of Its Auto Sales
HPL Electric & Power: Smart Meters, Wires and Two Engines
Kaynes Technology: EMS, Chip Plants and ₹10,563.5 Cr Orders
Sterlite Technologies: Glass Rods to Hyperscaler Deals
Explore our Products
Research Framework
Emerging Titans
Combination of quantitative analysis, industry tailwinds, and management assessment - SPRINT investment philosophy
Tiny Titans
Heavy emphasis on scuttlebutt research, plant visits, and early on-ground signals



India's Aerospace Opportunity
Global Demand. Supply Bottlenecks. Opportunities Ahead.
Don't Miss This Exclusive Webinar!
Join Value Educator to decode the key trends shaping India's aerospace sector and learn how to identify tomorrow's potential leaders in the space.
- How the aircraft value chain works, layer by layer
- Indian companies supplying global aircraft makers
- A framework to judge any aerospace company

 Orders
 Subscription
 Share with friends


Required Details
₹23999.00
(12 month subscription)
As per SEBI regulations, all users are mandated to complete the KYC that is validated for 1 year. Post payment, you will be redirected to the KYC screen


No comments yet. Be the first to comment!