
Inventory Turnover Ratio Explained
Ever seen ‘bumper results’ from your favorite retail stock… and a totally thanda share price?”
Trent Limited hits a fresh high, or Honasa Consumer (Mamaearth) reports strong revenue growth. Business channels turn euphoric, social media is full of rocket emojis, and everyone suddenly has a hot take on these stocks. Maybe you even hold one of them in your portfolio. On paper, the numbers look great, the story sounds solid, but when you open your trading app, the stock is flat… or even down. That awkward moment of staring at your P&L and thinking, “Market ko kya dikhta hai jo mujhe nahi dikh raha?” is something almost every Indian retail investor has felt.
Most of us stop at the obvious stuff: revenue growth, profit growth, new stores, flashy marketing, maybe a quick look at the PE ratio. That’s not enough, and exactly where a “dull-looking” but incredibly powerful metric quietly enters the scene: the Inventory Turnover Ratio. For retail and manufacturing companies, this number tells you how quickly the business is converting products on shelves into actual sales and cash. If inventory keeps piling up, it could mean weak demand, poor planning, or money getting stuck in boxes instead of working for shareholders. If inventory is moving at a healthy pace, it usually points to improved execution, better cash flow, and disciplined management, the kind of traits markets appreciate over the long term.
In simple words, Inventory Turnover Ratio is the silent X‑ray of retail and manufacturing stocks; it shows you whether a company is truly selling smart or just stocking up stores.
What is the Inventory Turnover ratio?
Caution, things are about to get a bit technical. But we’ll make it easy.Imagine you run a kirana store, where customer walk-in asking, “Bhaiya, Maggi hai?” and you secretly hope Maggi is there. Now, think of the Inventory Turnover Ratio as a report card that tells you how quickly your stock of that Maggi moves and whether your stock rotates briskly like festival-season shoppers or sits sluggishly like unsold Diwali gift boxes.
In finance terms, this ratio measures how many times you sell and re-stock your inventory in a period, using the formula COGS divided by Average Inventory.
Why divide by COGS and not by Sales?
Because inventory is always valued at cost, not at selling price, a key rule emphasized in the CFA curriculum. Higher the ratio, the better it is.Since your store’s stock keeps fluctuating, we use Average Inventory (opening + closing ÷ 2) to get a fair picture of what was really available for sale during the period, aligning with how analysts smooth inventory volatility.
Once you know turnover, you can convert it into something every store owner intuitively understands, Inventory Days, calculated as 365 divided by turnover, telling you how many days your goods sit on the shelf before being sold.
A high turnover and low inventory days mean your stock is selling fast, cash isn’t stuck, and customers see fresh products, though excessively high turnover may hint at risky stockouts. On the other hand, a low turnover warns of dusty, dead stock, expiry risk, trapped capital, and the potential need for heavy discounts.
For retail investors trying to understand companies like D‑Mart, Trent, HUL, or Bata, this ratio becomes like a clear pair of glasses; it lets you see how efficiently the business is actually running behind the scenes. It shows you whether cash is flowing smoothly, whether customers truly want the products, and whether management is keeping things tight. Because just like in your own kirana shop, no company can stay profitable for long if its inventory isn’t moving smartly and consistently.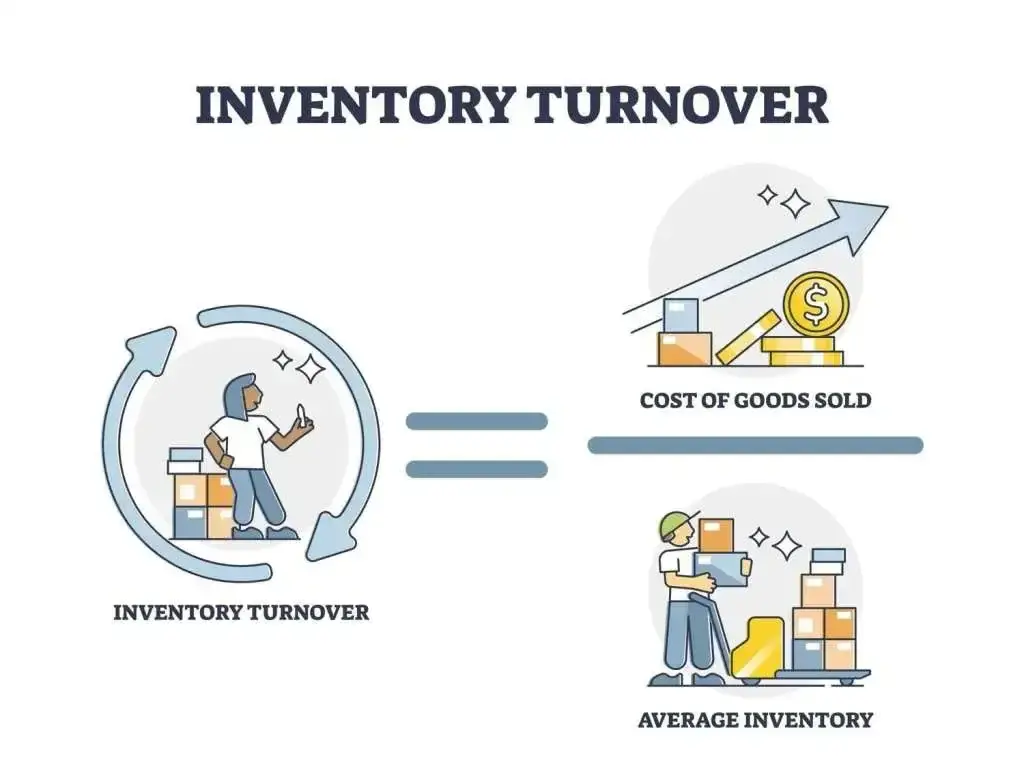
Let's take an example, at the start of the year you had ₹2,00,000 worth of stock, and by year‑end it had grown to ₹2,50,000. During the same year, you sold goods that cost you ₹10,00,000 (remember: inventory is always measured at cost, not MRP). To check how efficiently your shelves actually worked, you’d first calculate your Average Inventory: (2,00,000 + 2,50,000) ÷ 2 = ₹2,25,000. This simple step tells you the real “working level” of stock you dealt with throughout the year. Not too high, not too low, just the average load your shop carried while serving customers.
Now apply the formula for Inventory Turnover = COGS ÷ Average Inventory = 10,00,000 ÷ 2,25,000 = 4.4 times.
In simple terms, your entire stock got sold and replaced 4.4 times this year, that's just fine! (Compared to D-mart)
To make it even simpler, convert this into Inventory Days: 365 ÷ 4.4 ≈ 82.95 days. That means your goods sit on the shelf for about 82 days before being sold. Lower days (like 30 - 45) suggest fast-moving stock and quicker cash flow, while higher days (like 120) hint at slow movement and blocked money. This is exactly why investors look at this ratio for retail companies like D‑Mart, Trent, HUL, or Bata, just like in your kirana store.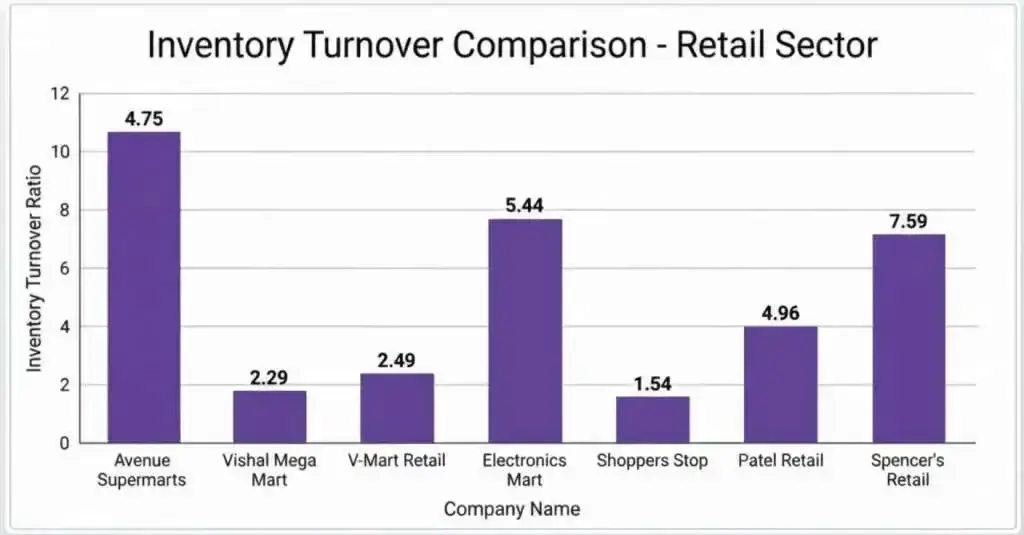
The chart clearly visualizes the performance gap between Avenue Supermarts and competitors, making the inventory turnover ratio an effective tool to analyze operational efficiency and working capital management in the retail sector.
Read More: A Fundamental Checklist: How to Research a Stock in 1 Hour
Why is the Inventory Turnover ratio significant? The Hidden Signal of Business Efficiency
To really understand the power of this ratio, we need to zoom out a bit and look at something called working capital. Working capital is simply the money a business needs for day‑to‑day running activities like buying stock, paying suppliers, managing daily operations, and paying wages. When a company holds too much inventory, it’s like stuffing all your savings into gadgets you don’t use, and your money gets locked up. But when inventory moves fast, the company frees up that cash quickly.
This brings us straight to cash flow. A business where inventory flies off the shelves doesn’t just look good on paper; it actually generates cash faster. Think of it like this:
Every time inventory moves, the company gets cash back sooner, which can then be reinvested, used to pay down debt, or fuel expansion. High turnover often means a shorter cash conversion cycle, which is a fancy way of saying the company doesn’t have its money stuck in warehouses but flowing back into the business where it can grow. In retail, especially, this is everything that the fastest sellers often become the biggest compounders.
Let me link this to Return on Capital Employed (ROCE), a metric every Indian investor should learn to love. ROCE tells you how much profit a company generates for each rupee invested in its business.
Here’s the magic: when a company has high inventory turnover, it needs less capital to run its operations. Less capital employed + healthy profits = higher ROCE. That’s why companies like D‑Mart or Titan often deliver eye‑watering ROCE where their stock doesn’t sit on shelves collecting dust; it moves, creating a compounding loop of efficiency.
Now, before you assume that rising turnover is always good news, let’s talk about the dark side: demand vs channel stuffing.
Real demand means customers are actually buying the product. Channel stuffing is when a company forces distributors or retailers to take excess stock just to show higher sales. On the books, inventory might look like it’s reducing, and turnover might even rise, but in reality, the shelves in the distributor’s warehouse are piling up. What to note here is that when inventory changes don’t align with real sales or when turnover rises without an improvement in demand, investors should be suspicious. This divergence is one of the classic red flags analysts use to detect low reporting quality or artificial sales boosts.
Put all of this together, and you realize that inventory turnover isn’t just a formula; it’s a multi‑layered signal that helps you decode whether a company is managing its money well, generating healthy cash flows, employing its capital efficiently, and growing on true demand rather than artificial sales tricks.
Read More: How to Analyze a Mid-Cap Company – A Complete, Practical Framework
Making the most out of the ratio?
To actually use Inventory Turnover like a pro, start with a simple but powerful five‑year trend analysis. Think of this as checking the “health record” of a company’s inventory habits over time, just like you’d observe your kirana shop for a few years before declaring it truly efficient. Instead of jumping straight into conclusions, note down revenue, COGS, average inventory, turnover ratio, inventory days, and how both inventory and revenue have grown in congruence. This is where the story unfolds.Once we account for everything, you will be able to immediately spot whether a company’s inventory turnover is climbing (a sign things are improving), staying more or less the same (steady, but nothing exciting), or slipping backward (a quiet warning that something may be off).
Then look at how fast inventory is growing compared to revenue. If inventory is growing faster than sales, it’s like buying too much stock relative to existing customer demand.
Finally, keep an eye on inventory days: are they shortening or quietly stretching out year after year? Rising inventory days are often the earliest indicator of slow-moving stock, even before profitability metrics show trouble. This multi-year view gives you depth, context, and clarity, allowing you to judge not just what the company is doing today, but how disciplined and consistent it has been over time.
Below are some practice examples, for which you will get the answer at this section:
Based on the multi-year trend for each company, decide:
- Which company’s inventory management is efficient?
- Which one is stable?
- Which one is deteriorating?
Generate insights:
- Turnover improving or deteriorating?
- Inventory days reducing or increasing?
- Relationship between Avg Inventory and COGS.
Write down your answer, and scroll ahead only after
Answers
Company A: Stable, Inventory turnover stays stagnant around 5.0, and inventory days remain unchanged around 72 days. Efficiency is hinting stability.
Company B: Deteriorating, Turnover falls from 6.0 to 4.4, and inventory days rise sharply from 61 to 83 days. Efficiency is deteriorating.
Company C: Improving, Turnover increases from 4.0 to 5.5, while inventory days drop from 91 to 66 days. Efficiency is improving.
Read More: Days Sales Outstanding (DSO) Explained: A Hidden Cash Flow Warning Signal
Inventory Correction is sometimes due to business cycles and economic fluctuations affecting business, which is NATURAL:
Sometimes companies end up with more stock than they can sell, just like when your kirana shop overestimates summer demand, and suddenly you’re staring at far too many soft drink crates. That phase where a business realises, “Oops, we stocked too much,” and then consciously slows production, cuts purchases, or runs discounts to bring inventory back to normal levels… that’s called inventory correction. It’s basically the company hitting the reset button on its stock levels. You’ll often hear this in corporate earnings calls or news updates, for example, when Indian AC manufacturers had to scale back production in 2025 after unseasonal rains caused demand to crash, forcing the entire sector into an inventory correction mode.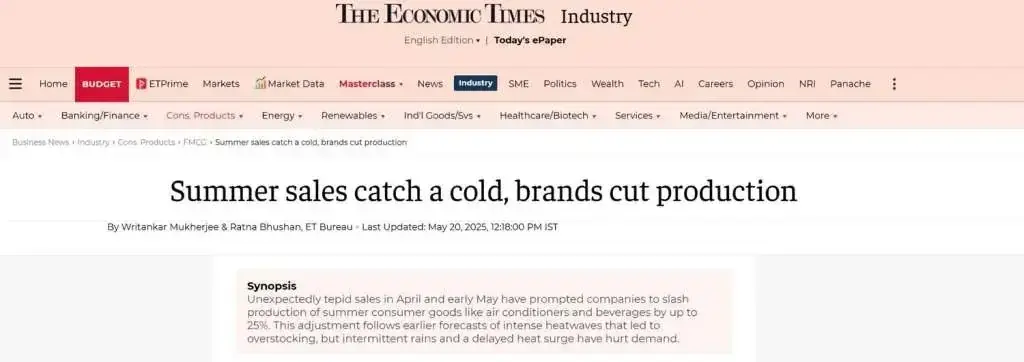
Unseasonal rains and cooler weather completely derailed summer demand in 2025, leaving companies with far more stock than they expected. Brands that had ramped up production, especially AC makers, beverage companies, and other summer-product firms, were suddenly stuck with unsold inventory and had to cut production by up to 25% to bring stock levels back to normal. Godrej Appliances even reported a 25–30% drop in sales in major regions.
This is a classic example of inventory correction, a normal rhythm in the business cycle where companies pump the brakes on production because demand has taken a short breather. And that’s completely natural. Inventory turnover doesn’t move in a perfect straight line; it swings with real life. A hotter or cooler season, a sudden rain spell, a shift in customer mood, all of these can make turnover rise and fall. It’s simply the business adjusting to how people actually buy, not a sign that something is fundamentally broken.
One more classic case, apparel, footwear, and home‑product brands continued offering deep discounts because they were stuck with high unsold inventory, and demand remained subdued across categories. Delayed winter, cautious consumers, and uneven footfall meant products weren’t moving according to the company’s expectation. So instead of letting stock pile up and get stale, brands chose the natural business-cycle response: clear inventory aggressively, reset shelves, and prepare for the next season.
This example explains that, sometimes demand dips, seasons shift, or forecasts go wrong, and companies naturally enter an “inventory correction” phase.
Read More: What is Debt to Equity Ratio? Why it Matters for Small Cap Investing
Explore our Products
Research Framework

Emerging Titans
Combination of quantitative analysis, industry tailwinds, and management assessment - SPRINT investment philosophy

Tiny Titans
Heavy emphasis on scuttlebutt research, plant visits, and early on-ground signals
Conclusion: The Real Reason Inventory Turnover Matters
At the end of the day, Inventory Turnover isn’t an accounting trick or a textbook formula you memorise for interviews. It’s a living, breathing behaviour metric, one that tells you how a business actually runs when the lights of the investor presentation are off. When you track this ratio, you’re not looking at numbers… you’re watching consumer demand in motion, management discipline in action, capital being deployed or wasted, and early warning signs quietly flashing before they show up in earnings.Inventory quietly shows you what’s really happening. When products fly off the shelves, it’s a clear sign that customers genuinely want what the company is selling. And when inventory starts piling up, it’s the business’s way of whispering that something’s off, maybe demand was overestimated, maybe distribution was pushed too hard, or maybe too much money is stuck sitting in boxes instead of working for growth.
And when you zoom out to multi‑year patterns, you begin to see the company’s true character: the efficient operators, the careless planners, the demand-driven winners, and the narrative-driven pretenders.
That’s the magic of this ratio. It transforms from a simple formula into a behavioural signal, then into a pattern, and finally into an investment insight.
Because once you start asking the deeper questions, Is this inventory movement real? Is it healthy? Is it accelerating? Is capital being used wisely? You’re no longer a surface-level investor. You’re analysing the pulse of the business.
If you take away one thing from this entire blog, let it be this: Companies don’t win because they report high revenue; they win because they convert inventory into cash efficiently, consistently, and honestly. Master this ratio, and you’ll start seeing retail and manufacturing stocks with a clarity most investors never achieve.
And just like that, a “boring little ratio” becomes one of the sharpest tools in your investing toolkit.
If reading until now was worthwhile, then comment “Inventory turnover ratio” below in the comments section and subscribe for more such articles.
Frequently Asked Questions (FAQ)
What is a good Inventory Turnover Ratio?
+There’s no universal benchmark. A good ratio depends on the industry. Compare the company with its peers and track its 3–5 year trend instead of chasing a random high number.
Is a very high Inventory Turnover always positive?
+Not always. While high turnover usually signals strong demand and efficiency, extremely high levels may indicate understocking, which can lead to stockouts and missed sales.
Why is COGS used instead of Revenue in the formula?
+Inventory is recorded at cost in financial statements, not at the selling price. Using revenue would overstate efficiency. That’s why:
Inventory Turnover = COGS ÷ Average Inventory
How does Inventory Turnover impact cash flow?
+Faster turnover means inventory converts into cash quickly, improving operating cash flow. Slower turnover locks money in unsold stock, increasing working capital pressure.
Can falling Inventory Turnover signal trouble?
+Yes. If turnover declines while inventory grows faster than sales, it may indicate weakening demand, overproduction, or potential channel stuffing. It’s an early warning sign worth investigating.
Should this ratio be used for all companies?
+No. It is most relevant for retail, FMCG, manufacturing, auto, and consumer goods businesses. Service companies typically don’t carry significant inventory, so the ratio isn’t meaningful for them.
What is the biggest mistake investors make with this ratio?
+Looking at it in isolation. Always analyze Inventory Turnover alongside revenue growth, margins, cash flow, ROCE, and industry trends. Context converts numbers into insight.

High growth stock specialist, Value Educator
Shashank Mahajan is an equity research professional with over 12 years of experience in identifying high-potential SME and micro-cap stocks at an early stage. He follows a rigorous scuttlebutt research–driven approach, combining on-ground insights with deep financial analysis. Shashank specializes in uncovering under-researched and under-owned companies with strong management quality and long-term growth potential. Through disciplined research and early identification, he focuses on spotting tomorrow’s market leaders before they enter the mainstream investor radar.

Glenmark: The USD 700 Mn Cancer Deal and Its Brands

Pharma Stocks in India 2026: Generics, APIs and CDMOs

Granules India: From Paracetamol to a 65% Gross Margin

Natco Pharma: After Revlimid, 29 Patent Challenges

Shilpa Medicare: Cancer APIs, Films and Biosimilars

Alembic Pharma: US Plants Pay Back, Margin Hits 22.2%
Explore our Products
Research Framework
Emerging Titans
Combination of quantitative analysis, industry tailwinds, and management assessment - SPRINT investment philosophy
Tiny Titans
Heavy emphasis on scuttlebutt research, plant visits, and early on-ground signals



Modern Warfare to Multibaggers
Key Trends. Strategic Shifts. Opportunities Ahead.
Today at 7:00 PM IST. Room opens 30 minutes before.
Don't Miss This Exclusive Webinar!
Join Value Educator to decode the key trends shaping India's defence sector and learn how to identify tomorrow's potential leaders in the space.
- In-depth research on India's defence sector
- Live Q&A session
- Actionable takeaways for long-term investors

 Orders
 Subscription
 Share with friends


Required Details
₹23999.00
(12 month subscription)
As per SEBI regulations, all users are mandated to complete the KYC that is validated for 1 year. Post payment, you will be redirected to the KYC screen


No comments yet. Be the first to comment!