
How to Read a Profit & Loss Statement

Let’s be honest: staring at a Profit & Loss (P&L) statement usually feels like trying to read the code in The Matrix without the cool sunglasses. It’s a wall of cold, gray numbers that seems designed to make your brain itch.
But here’s the reality check: If you can’t make sense of this document, you aren’t actually running a business, you’re just guessing. As NYU Professor Aswath Damodaran puts it, "Numbers without a story is a nightmare."
Most people stay trapped in that nightmare because they think a P&L is just a glorified receipt. It’s not. It’s the action movie of your financial life. While a Balance Sheet is just a static "still photo" of what you own at a single moment (if you want to go deeper, read How to Read a Balance Sheet Like a Professional Investor), the P&L captures the movement, the hustle, the grind, and, if you play your cards right, the ultimate payoff.
Think of your Profit & Loss statement as the "logbook" of a ship finally pulling into port after months at sea. When you step onto the dock, your investors aren't just looking for a chest full of gold; they want to see the records that explain exactly how you got it. Far from being a dry stack of boring numbers, your P&L is the play-by-play narrative of your journey. It tells the story of every storm you weathered and every trade you made over the year.
Every financial year is a high-seas adventure, and your Revenue is just the opening scene. But as any seasoned captain knows, the real story isn't how much gold you brought into port, it's how much survived the voyage.
From the first "Conflict" of Direct Costs (your silk and timber) to the "Daily Grind" of Operating Expenses (port fees and messenger birds), your margins are constantly under siege. Even if you survive the journey, you still have to face the final "Villains": interest on ship loans and the King’s inevitable taxes.
What remains at the Bottom Line reveals the ultimate truth: are you ready to refit the fleet for another voyage, or has your ship been taking on water the whole time?
If you can’t read your P&L, you’re flying your business blind. You might see plenty of cash in the bank, but without understanding the layers of profitability, you won’t know if your success is sustainable or just a lucky streak. Fortunately, you don’t need an MBA to master your margins. In just 10 minutes, we’re going to strip away the jargon and show you the three "pressure points" that tell you everything you need to know about your company's health.
Now, let’s break down the actual scoreboard that decides if that story ends in a celebration or a crisis.
What is a Profit & Loss Statement?
Look at a Profit & Loss (P&L) Statement or an Income Statement as the actual scoreboard for your business. While a Balance Sheet is really just a "snapshot" of what you own and owe at one specific moment, the P&L is more like a highlight reel. It tracks the actual flow of money over a set window of time, whether that’s a month, a quarter, or an entire year. Its job is pretty straightforward: it tells you if you’re actually turning a profit or if you’re just staying busy while the money disappears.
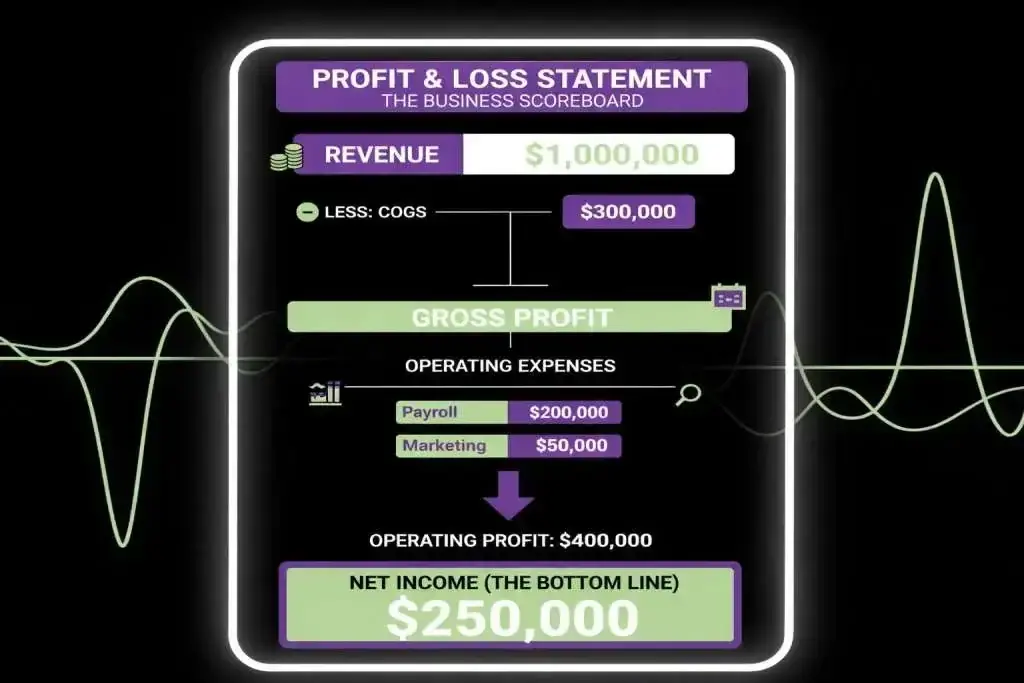
The document follows a logical, step-by-step structure. We call this "moving from the top line to the bottom line." It starts at the very top with Revenue, which is the total amount of money you brought in from sales before a single expense is touched.
From there, the statement begins to peel away costs. First, it subtracts the Cost of Goods Sold (COGS), the direct expenses of creating your product, to show your Gross Profit. As you move further down the page, you subtract Operating Expenses (the overhead), such as rent, payroll, and marketing. By the time you hit the final line, you’ve accounted for every bill, interest payment, and tax obligation.
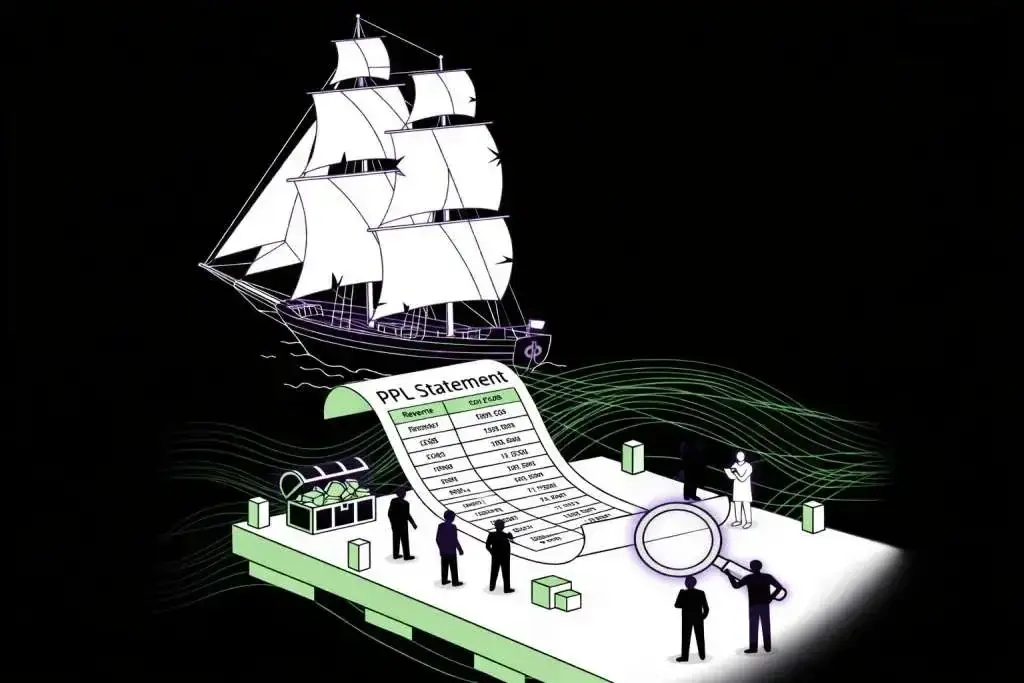
Ultimately, the P&L is the ultimate reality check. You can have millions in sales, but if your costs are higher, your P&L will show a Net Loss in no uncertain terms. On the flip side, a healthy Net Income, the famous "Bottom Line," proves the business is efficient enough to actually keep a portion of what it earns. Reading a P&L isn't just about doing math; it’s about looking past the revenue to see if the business model actually works in the real world.
Before we get to the profit, we have to audit the source: let’s dive into why your total sales might be lying to you and how to spot a revenue "fluke."
Checklist for Profit & Loss Statement
1. The Revenue Reality Check
Before you celebrate a high "Top Line," you need to dig into where that money is actually coming from.
- Sales Consistency: Is your revenue growing month-over-month, or did you just have a one-time "fluke" sale that’s making the numbers look better than they are?
- Returns & Allowances: Have you accounted for refunds and discounts to get your Net Sales? Gross numbers don't matter if the money is flowing back out the door.
- Revenue Concentration: Are you relying on one single client for 80% of your income? If so, you're one bad day away from a crisis.
2. The "Direct Cost" Audit (COGS)
Think of this section as the ultimate gut check for your pricing. It’s where you find out if you’re actually charging enough to justify the effort.
- Gross Margin %: Is your Gross Profit actually high enough to pay for your overhead, like rent and staff? If it isn't, you aren't running a business, you’re running a charity. A weak margin usually means your business model is broken right at the source.
- Variable Costs: Have you checked your raw material prices lately? Whether it's shipping rates, ingredients, or software seats, these costs change. If your expenses went up but your prices stayed the same, you're the one paying the difference, not your customer.
- Waste & Spoilage: Are you bleeding money on inventory that sits on a shelf and expires, or on hours of service that never actually get billed? Every bit of waste here is a direct hit to your pocket.
3. The Operating Expense (OPEX) Scrub
These are the "fixed" costs that chew through your profits every single day, whether you’re making sales or not. Think of them as the cost of just keeping the lights on.
- The "Subscription Creep": Take a hard look at your bank statement. Are you still paying for software, apps, or memberships that your team hasn't actually touched in months? These small monthly charges add up to a massive leak over a year.
- Payroll vs. Revenue: Is your team’s cost actually in sync with the money coming in? It’s incredibly easy to over-hire during a busy month and then get stuck with a massive bill when things inevitably quiet down.
- Marketing ROI: For every dollar you’re pumping into ads, can you actually prove it’s moving the needle on your "Top Line"? If you can’t track the return, you’re not marketing, you’re just gambling.
- Rent & Utilities: Are these staying consistent, or are you starting to see hidden fees and sneaky rate hikes creep into your monthly bills?
4. The "Below the Line" Finalists
These are the items that crawl out of the woodwork after all the heavy lifting is done. It’s easy to treat them like afterthoughts, but in reality, they have the power to flip a great year into a total disaster.
- Interest Payments: You have to ask yourself: Is the interest on your business loans eating up more than the actual profit that borrowed money helped you generate? If the debt is more expensive than the growth it's fueling, you're moving backward.
- Tax Provisions: Have you actually set aside enough for the "King’s share"? Nothing kills a business faster than getting hit with a massive, surprise tax bill at the end of the year when you’ve already spent the cash.
- Depreciation: This is a silent profit killer. Don’t overlook depreciation. Every piece of gear, from your delivery van to your espresso machine, loses value as it wears down daily. If you aren't accounting for that decline now, you’ll be in for a rough reality check when things break and you realize you haven’t saved a dime for replacements.
Let’s look under the hood to see if your production costs are quietly eating your lunch before you even pay your rent.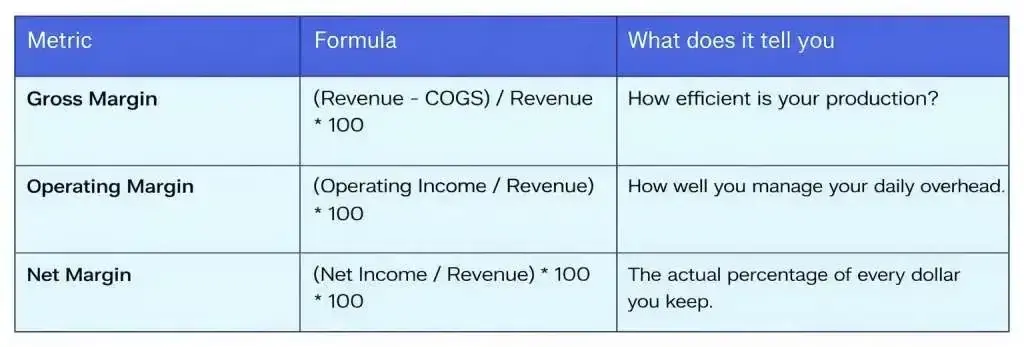
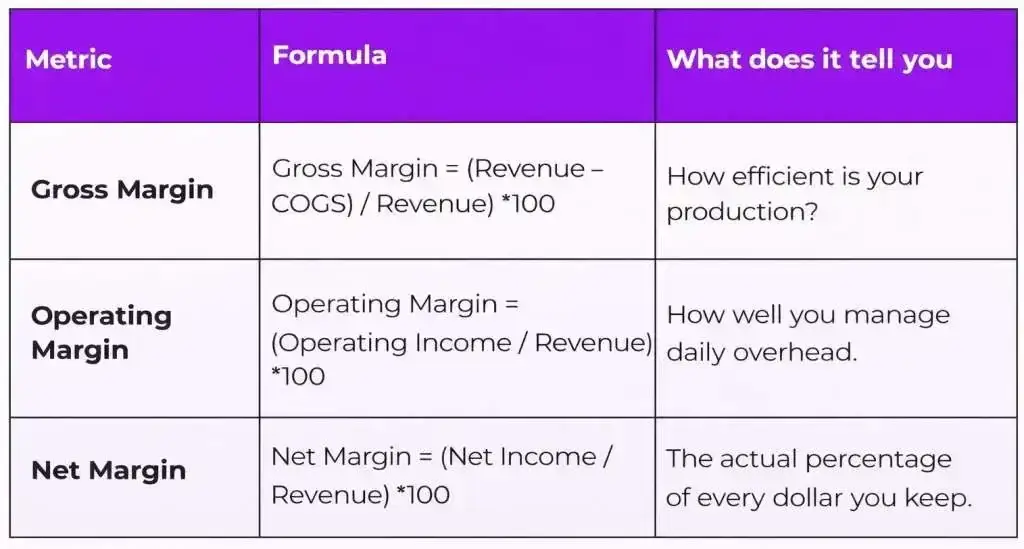
To see exactly how these "leaks" look in the wild, let's look at the "Growth Trap" of Apex Electronics, where a $500,000 sales jump led straight to a $50,000 disaster.
If you want to understand how profitability metrics influence valuation and why investors obsess over them, read EBITDA Explained: Why Investors Use It — And When It Misleads.
The Case of Apex Electronics: A "Growth" Trap
Imagine a founder, Sarah, standing on a stage in late 2024. Her company, Apex Electronics, is the "it" brand. Their high-end headphones are everywhere. The revenue is skyrocketing, and on paper, she’s a genius.
But by December 2025, the lights are flickering. Despite selling more headphones than ever before, the bank account is dry. Sarah is left asking the most painful question in business: "If we’re selling so much, why am I broke?"
In 2024, Apex was a lean, mean machine. They pulled in $1 million and kept a healthy $100,000 in profit. They had a "formula" that worked.
Then came 2025. Sarah wanted to go "nuclear." She chased growth at any cost, and the top line responded by jumping to $1.5 million. To the outside world, Apex was a rocket ship. To the P&L, it was a ship hitting an iceberg.
Step 1: Comparing the Two Years
When you put the two years side by side, the "math" turns into a "mystery" that needs solving.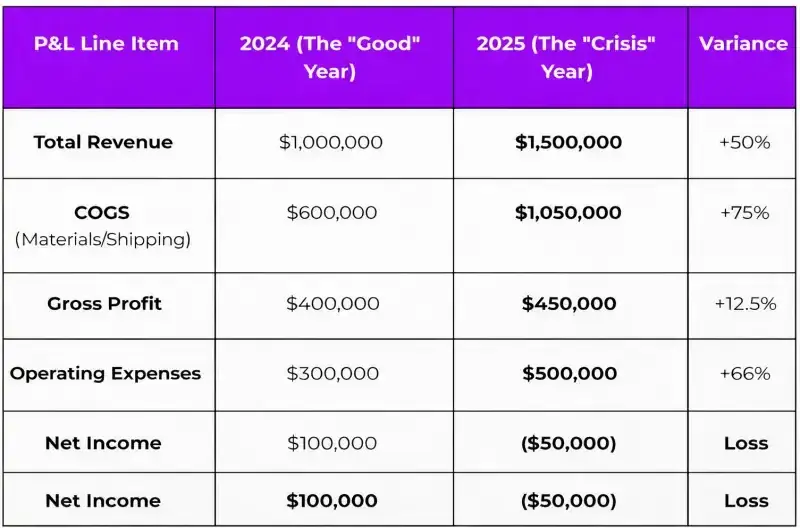
Step 2: The Analysis (Spotting the "Leaks")
By digging into the numbers, we found three major red flags that explain why a 50% jump in sales actually triggered a massive loss:
- The Gross Margin Crumbled: In 2024, their Gross Margin was 40%. By 2025, it fell to 30%. The Real Reason: To chase higher sales numbers, Apex started offering "Free Express Shipping" and aggressive discounts. They were moving more product, but the cost of getting those headphones to customers (COGS) grew way faster than the actual money coming in.
- Scaling "Bloat" (The Middle Section): Operating Expenses shot up from $300k to $500k. The Real Reason: To keep up with the new orders, they panicked and hired 10 new people while moving into a much more expensive warehouse. Their "fixed costs" grew by 66%, even though their Gross Profit numbers only nudged up by 12.5%. They basically built a massive, expensive engine for a car that wasn't actually going much faster.
- The Negative Bottom Line: Even though they brought in an extra $500,000 in revenue, the company ended the year $50,000 in the hole.
Step 3: The Turnaround Plan
Once the P&L revealed the truth, the CEO didn't need a miracle; he just needed a better strategy. He took three specific steps:
- Cut the "Leaky" Sales: He killed the free express shipping offer and stopped discounting the flagship headphones.
- Trimmed the Fat: He looked at the $500k in operating costs and introduced warehouse automation to reduce the reliance on a bloated payroll.
- Price Correction: He raised prices by a modest 5%. Because the product was high-end, customers stayed, and the Gross Margin finally began to recover.
Step 4: The Great Pivot
The P&L wasn't just a report; it was a roadmap for the turnaround. Sarah realized she didn't need more sales; she needed smarter sales. She took three surgical steps:
- Killing the "Leaks": She stopped the "Free Express Shipping" madness. If you wanted the headphones fast, you paid for it.
- Trimming the Bloat: She replaced manual warehouse chaos with a simple automation system, allowing her to scale without a massive, expensive payroll.
- The Power Move: Since Apex was a premium brand, she raised prices by 5%. The "discount hunters" left, but the loyal fans stayed.
The Moral of the Story
The big lesson? Sales are for show, but profit is for survival. Apex almost killed itself trying to look like a giant on paper while actually bleeding out. By shrinking the noise and focusing on the math, they stopped being a "busy" company and started being a profitable one.
This is why serious investors look beyond topline growth and focus on compounding profitability, as discussed in Beyond Revenue Growth: 10 Mid-Cap Stocks Where Profits Compound.
Explore our Products
Research Framework

Emerging Titans
Combination of quantitative analysis, industry tailwinds, and management assessment - SPRINT investment philosophy

Tiny Titans
Heavy emphasis on scuttlebutt research, plant visits, and early on-ground signals
Conclusion
The story of Apex Electronics is a massive wake-up call for any business owner: Revenue is vanity, profit is sanity, but cash is reality. Learning to read a P&L isn't about becoming a human calculator or memorizing every tiny line item; it’s about training your eyes to catch the "leaks" in your ship before they actually sink you. When you look at your own P&L, stop seeing it as just a boring list of costs and start seeing it as a strategic map. If you see your Top Line growing while your Bottom Line is shrinking, your business has a major plot hole that needs to be fixed immediately. By staying on top of your margins, cutting out the "middle bloat" in your expenses, and watching the relationship between your costs and your sales like a hawk, you stop being just a passenger and start acting like the captain of your financial future. These numbers aren't here to scare you; they are literally telling you what your next move should be. Now that you’ve mastered the story behind the math, it’s time to go write a better ending for your next fiscal year.
If you’re just beginning your investing journey and want a structured roadmap, start with A Beginner's Guide to Investing in the Indian Stock Market (2026 Edition).
If this guide helped you to think in a systematic manner, comment “WEALTH” below with your own stories or questions!
FAQs ( Frequently Asked Questions )
Is the revenue growth "organic" or are they just "buying" it?
+You need to look at the relationship between your Sales and Marketing spend versus your actual Revenue growth. If your revenue went up by 20% but you had to double your marketing budget to get there, that’s not sustainable growth, it's an expensive customer acquisition habit. Real growth happens when your revenue starts to outpace the cost of finding new customers.
Does the business have real "Operating Leverage"?
+This is a fancy way of asking: "How much of every new dollar goes straight to the bottom line?" If you’re a software company with high fixed costs, once you pass your break-even point, almost every new sale is pure profit. But if your costs (like labor or materials) rise perfectly in sync with your sales, you lack the "scale" that makes a business truly valuable to an investor.
Are "one-time" items hiding the truth?
+Don't let a massive profit or a sudden loss fool you without checking the "Other Income" or "Non-recurring Expenses" lines. A company might look like it’s killing it because they sold off an old warehouse, not because their products are actually selling. Always strip away these one-time events to find the Normalized Earnings, the money the business makes on a normal Tuesday.
How does the Gross Margin look against the rest of the industry?
+Gross Margin is your "moat." If you’re pulling a 70% margin while everyone else in your industry is struggling at 40%, you’ve clearly got a superior process or enough brand power to charge a premium. If you see that margin shrinking over time, it’s a red flag that the business is losing its edge and becoming just another "commodity."
Is that "Net Income" actually sitting in the bank?
+A P&L can show a profit even if the bank account is empty. That's the trick of accrual accounting. You have to peek at the Cash Flow Statement to be sure. If a company reports a million dollars in profit but "Cash Flow from Operations" is negative because customers haven't actually paid their bills yet, you’re looking at a "paper profit" that can’t pay the rent.

High growth stock specialist, Value Educator
Shashank Mahajan is an equity research professional with over 12 years of experience in identifying high-potential SME and micro-cap stocks at an early stage. He follows a rigorous scuttlebutt research–driven approach, combining on-ground insights with deep financial analysis. Shashank specializes in uncovering under-researched and under-owned companies with strong management quality and long-term growth potential. Through disciplined research and early identification, he focuses on spotting tomorrow’s market leaders before they enter the mainstream investor radar.

Glenmark: The USD 700 Mn Cancer Deal and Its Brands

Pharma Stocks in India 2026: Generics, APIs and CDMOs

Granules India: From Paracetamol to a 65% Gross Margin

Natco Pharma: After Revlimid, 29 Patent Challenges

Shilpa Medicare: Cancer APIs, Films and Biosimilars

Alembic Pharma: US Plants Pay Back, Margin Hits 22.2%
Explore our Products
Research Framework
Emerging Titans
Combination of quantitative analysis, industry tailwinds, and management assessment - SPRINT investment philosophy
Tiny Titans
Heavy emphasis on scuttlebutt research, plant visits, and early on-ground signals



Modern Warfare to Multibaggers
Key Trends. Strategic Shifts. Opportunities Ahead.
Today at 7:00 PM IST. Room opens 30 minutes before.
Don't Miss This Exclusive Webinar!
Join Value Educator to decode the key trends shaping India's defence sector and learn how to identify tomorrow's potential leaders in the space.
- In-depth research on India's defence sector
- Live Q&A session
- Actionable takeaways for long-term investors

 Orders
 Subscription
 Share with friends


Required Details
₹23999.00
(12 month subscription)
As per SEBI regulations, all users are mandated to complete the KYC that is validated for 1 year. Post payment, you will be redirected to the KYC screen


No comments yet. Be the first to comment!