
How to Read a Balance Sheet

Most people think successful investing is about spotting fast-growing companies or chasing impressive profit numbers. That’s how many investors learn the hard way that balance sheet strength matters equally in a business.
When Warren Buffett invests, he doesn’t begin with the income statement. He starts with the balance sheet.
“I look for companies that can survive bad times,” he once said.
Because profits can disappear in a single bad year.
Cash shortages can’t.
The balance sheet quietly answers the questions most investors forget to ask:
- Can a company pay its bills if sales slow down?
- Can it withstand a recession, an increase in interest rates, or a sudden shock?
That ability to survive — not just grow — is written clearly in one place.
And learning to read it the way professional investors do can completely change how you evaluate a business.
Introduction — Why the Balance Sheet Matters
For most investors, the first reaction is to look at earnings. Increased revenues, increased margins, and earnings growth are comforting to see. However, experienced investors realize that earnings do not tell the entire message.“Financial statements don’t hide the truth — poor reading does.” — Howard Mark
The balance sheet reveals something much more significant: namely, whether an enterprise has been financially sound enough to ensure it lives when things do not go as planned. While an income statement portrays historical performance, a balance sheet provides a snapshot or a point-in-time perspective on what a company owns, what it owes, or what it really owns on behalf of its shareholders.
This explains the intensity of interest that professional investors demonstrate towards the balance sheet. They look at the balance sheet to evaluate the liquidity position, leverage position, and overall robustness of the finances. It enables them to answer difficult yet essential questions like: To what extent is the operation dependent on leverage? How easily can it convert its assets into cash?
One way to understand the answer is by examining their balance sheets. What may appear to be a dull document is, in fact, a profound way to look at how a company is really using its finances — how the dollars come in, how they go out, and what kind of risks exist underneath.
For professional investors, what matters most in a company isn’t short-term earnings or flashy growth—it’s financial resilience, strong liquidity, sensible leverage, and the ability to sustain growth and dividends over the long term.
Read: A fundamental checklist: How to research a stock in 1 hour : LINK
After you comprehend the significance of a balance sheet, the next step would be understanding its functioning process.
Ultimately, every balance sheet, regardless of the corporation or the field of operation, is based on a simple foundation.
The Accounting Equation — The Foundation of Every Balance Sheet
Assets = Liabilities + Shareholders’ Equity
On the surface, this looks like basic accounting. In reality, it’s a powerful way to understand how a business is funded.
Each asset owned by a firm, whether it was cash, real estate, equipment, or investments, has been paid for in one of two ways. The firm either borrowed the money to buy it, or it was bought with the investment capital of the shareholders’ equity. There is no third option.
This equation forces investors to think differently. It shifts the focus from how much a company owns to who ultimately has a claim on those assets. An organization that possesses good assets but high liabilities may seem attractive; however, it also involves a great deal of risk. Alternatively, an organization that has small assets but minimal liabilities can withstand challenging situations much better than others.
Professional investors use this equation as a mental framework. They not only read a balance sheet entry by entry—they also wonder how assets are financed and whether this funding mix can withstand changing circumstances. Knowing this connection is a step toward being able to read a balance sheet like a stock market expert instead of an accountant.
Before diving into individual numbers, it’s important to shift from theory to reality. Balance sheets only start to make sense when you see how they apply to an actual business. This is where theories are translated into valuable information for investors.
Breaking Down the Balance Sheet Components
Before examining each part, there is an important point to clarify before embarking on an analysis of each component: which balance sheet are we examining?
Normally, publicly traded firms have to prepare both standalone and consolidated financial statements, together with simultaneous disclosure.
Although the balance sheet displays the outstanding balance of the firm alone in standalone form, the consolidated balance sheet displays the outstanding balance of the firm along with the outstanding balance of its subsidiaries in the same statement.
To apply this treatment for practical purposes of analysis, this treatment may incorporate and apply to the consolidated balance sheet of Tata Consultancy Services, i.e., FY 2024-2025. Since TCS enjoys a global presence through its subsidiaries, its respective cash flows, assets, and liabilities are present. Hence, by considering the consolidated balance sheet, the analysis is performed as if it were experienced by the investors. TCS
With this background in mind, it is now possible to analyze each piece of the balance sheet equation – assets, liabilities, and shareholders' equity – to better understand what smart investment professionals look for in each.
Assets — What the Company Owns (and How Investors Read Them)
Assets are resources that a company owns or controls that are expected to generate future economic benefits.
“Assets are only valuable if they can generate future cash flows.” — Aswath Damodaran
They are divided into a balance sheet as follows:
Current assets: These are the assets that can be easily liquidated in cash in the upcoming year, e.g., cash, receivables, etc.
Non-current assets: Such assets are associated with long-term value, which includes property and equipment along with intangible assets such as patents or goodwill.
Aside from this, investors may examine the trend of fixed assets over time. For example, increasing fixed assets may indicate expansion, modernization, and investment for potential growth. However, professionals compare this trend to other variables like revenue and profitability trends to assess value efficiency.
Yet another important item on the list is "Capital Work in Progress" or CWIP, which represents the capital expenditure currently under construction and not yet operational. CWIP also offers early indicators of future capacity expansion and strategic investments. Here, an investor would be interested to know whether this investment eventually adds to the organization's future revenues.
A professional investor doesn't look at the numbers alone. They read assets to understand liquidity, operational efficiency, and long-term growth potential.
Read- Top Stocks Under ₹100 that Have Strong Balance Sheets ; LINK
Assets in TCS — FY 2024–25 (Consolidated Balance Sheet)
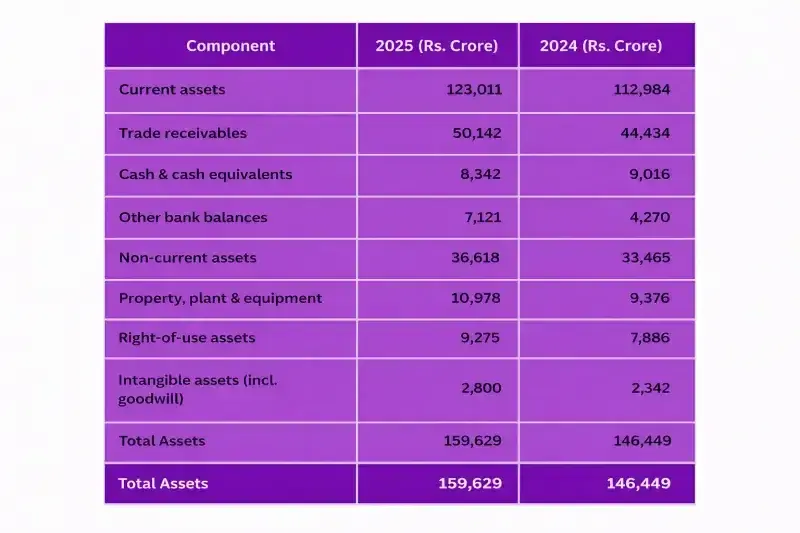
In TCS’s consolidated balance sheet:
Total assets: ₹1,59,629 crore
Current Assets: ₹1,23,011 crore mainly in the form of trade receivables of ₹50,142 crore, cash & cash equivalents of ₹8,342 crore, other banker balances of ₹7,121 crore.
Non-current assets: ₹36,618 crore - These include assets like property, plant, and equipment (₹10,978 crore), right-of-use assets (₹9,275 crore), and intangible assets like goodwill (₹2,800+ crore), indicating that TCS has been in the business
Investor takeaway:
It may seem strange that TCS has the right mix of assets – enough to fund current and long-term activities and growth without sacrificing long-term business models. Shareholders want to know the quality and liquidity of both long and short assets.
“Liquidity is about survival; profitability is about success.” — Peter Drucker
Liabilities: What the Company Owes (and How Risk Shows Up)
Liabilities are a company's financial obligations or its debt. They are money that a company has to pay out to its creditors, its employees, its suppliers, and possibly the government. A company's balance sheet lists its liabilities under three categories.They are its:
- Current Liabilities: The liabilities which are to be cleared within a year are called current liabilities or trade payables.
- Non-current liabilities: This category of liability would include long-term lease arrangements, long-term borrowing contracts, or long-term taxes owed.
Investors analyze liabilities in terms of liquidity risk, discipline, and dependence on debts. It is not that we should stay away from them; rather, they should be proper.
Liabilities in TCS- FY 2024-25 (Consolidated Balance Sheet)
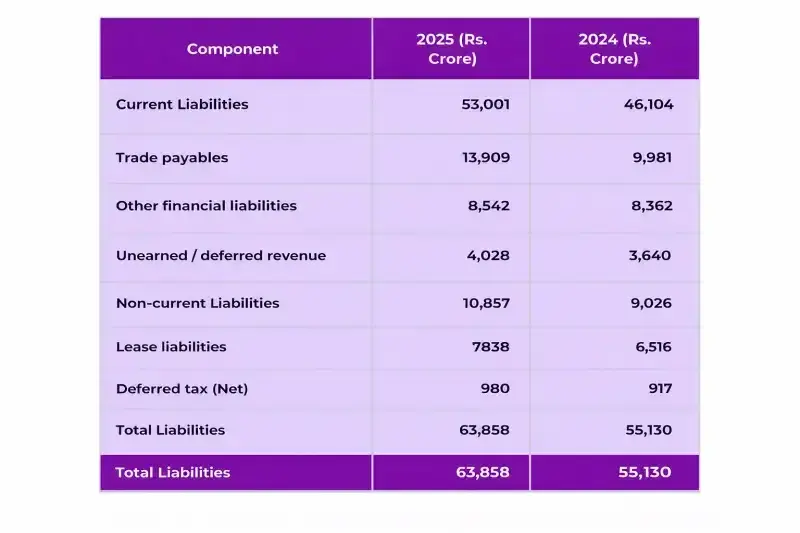
Total liabilities: ₹1,59,629 crore
Current liabilities: ₹53,001 crore – largely because of trade payables (₹13,909 crore), other financial liabilities (₹8,542 crore), and unearned/revenue liabilities (₹4,028 crore)
These are largely operational in nature, not debt-heavy.
Non-current liabilities – ₹10,857 crore, including lease debt and deferred taxation, not a result of borrowing but a long-term commitment.
Noteworthy is the fact that TCS bears very less traditional debt, thereby minimizing risks in a financial sense.
Investor takeaway:
TCS’s liabilities are operational, predictable, and well-covered by assets, indicating strong liquidity and a conservative financial structure — a key sign of balance sheet strength.
Shareholders' Equity - What Truly Belongs to Shareholders
Shareholders’ equity essentially shows what remains in the company, i.e., what shareholders would own, when all debts are settled or paid.Mostly, the equity includes: Share Capital, Money invested by shareholders, Retained earnings: Profits reinvested in the business.
Professional investors also pay close attention to how reserves grow over time. Rising reserves typically indicate that profits are being retained and reinvested internally rather than funded through new debt or equity issuance. Consistent reserve growth signals internal compounding — a key indicator of long-term financial strength and disciplined capital allocation.
"Long-term value creation and capital discipline are what investors care most about in terms of equity."
Shareholders’ Equity in TCS — FY 2024–25 (Consolidated Balance Sheet)
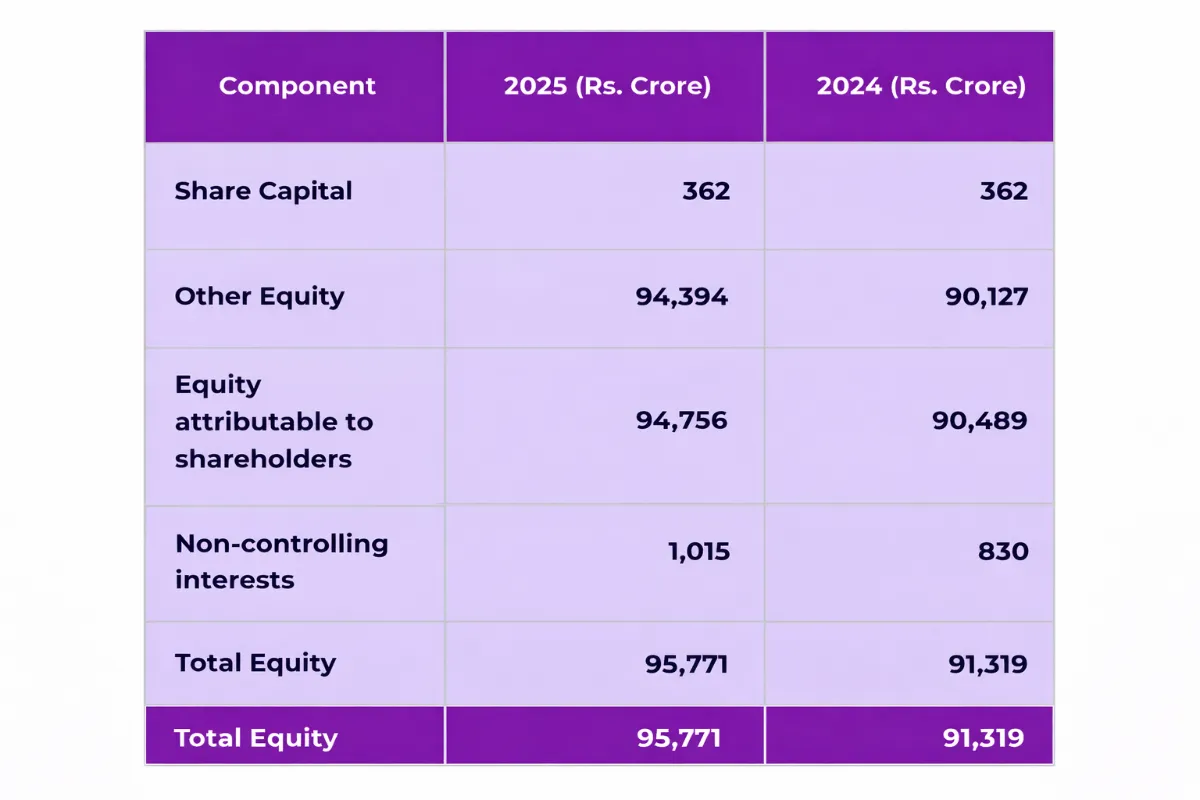
Total equity: ₹95,771 crore
Equity attributable to Shareholders: ₹94,756 Crores — largely made up of Retained Earnings. There has been no dilution of capital over the years.
This steady growth in equity, along with low leverage ratios, also shows that TCS has been financing its growth primarily in-house.
Professional investors rarely analyse balance sheets in isolation. Investments in fixed assets and CWIP eventually flow into operating performance once new capacity becomes productive. When revenues grow faster than fixed costs, operating leverage improves — allowing profits to expand disproportionately compared to revenue growth.
Investor takeaway:
A large and growing equity base generally indicates consistency, solidity, and buoyancy in terms of finance and capital base, which is common among professional investors.
To investors, the real insight lies not in individual numbers, but in how they relate to each other — which is exactly what ratios reveal.
Ratios — The Tools Professionals Use
Once a balance sheet is analyzed into its three components: assets, liabilities, and equity, a further step is taken by professionals in the field.“Ratios tell you where to look, not what to think.” — Benjamin Graham
Rather than looking individually at each number that is present, we group these pieces together using the help of the ratios that exist within the puzzle.
Ratios help answer practical questions:
- Can the company meet short-term obligations?
- Is it over-leveraged?
- How comfortable is its debt position?
Using TCS’s consolidated balance sheet for FY 2024–25, the following ratios give a clearer picture of its financial strength.
Current Ratio
Current Ratio = Current Assets ÷ Current LiabilitiesWhat it means:
The current ratio reflects a company’s ability to meet short-term obligations with short-term assets. Normal values for current ratio are above 1. This means current assets are greater than current liabilities.
TCS calculation (FY 2024–25):
- Current Assets: ₹1,23,011 crore
- Current Liabilities: ₹53,001 crore
- Current Ratio ≈ 2.3
Interpretation:
This means its assets are more than double what is needed to meet its short-term obligations. The message conveyed to investors is: liquidity is very high and risk is extremely low.
Debt-to-Equity Ratio
Debt- to- Equity Ratio = Total Debt ÷ Shareholders’ EquityWhat it means:
This ratio shows how much a company relies on borrowed funds compared to shareholders’ capital. Lower values generally indicate lower financial risk.
TCS calculation (FY 2024–25):
- Total Debt: ₹0
- Shareholders’ Equity: ₹95,771 crore
- Debt-to-Equity Ratio: 0
Interpretation:
A debt-to-equity ratio of zero implies that the company does not take any debts. Its whole business is being funded by shareholders. For professional investors, it reflects that the balance sheet of the company is strong and that there is minimal risk and financial downturn.
It is important to note that professional investors do not judge debt using absolute numbers alone. Rising debt does not automatically mean increasing risk. The point is that, other things equal, faster equity growth through retained earnings or expansion will allow leverage to increase. The question is whether the capital structure is balanced and sustainable, not whether it is free of leverage.
Read more about debt to equity here: LINK
Net Debt
Net Debt = Total Debt – Cash and Cash Equivalents
Net debt shows a company’s actual debt burden after accounting for cash reserves. A low or negative net debt position indicates strong financial flexibility.
TCS calculation (FY 2024–25):
- Cash & Cash Equivalents: ₹8,342 crore
- Debt levels: Minimal
- Net Debt: Close to zero / effectively negative
Interpretation:
TCS has enough cash to comfortably offset its debt obligations. This gives the company strategic flexibility — it can invest, acquire, or return capital to shareholders without financial strain.
Interest Coverage Ratio
Interest Coverage Ratio = EBIT ÷ Interest Expense
This ratio shows how easily a company can service its interest obligations from operating profits.
Why it’s not calculated here:
Interest coverage requires income statement data, not just the balance sheet. However, given TCS’s low debt levels, interest obligations are minimal — implying strong interest coverage in practice.
Investor takeaway:
Even without an exact calculation, TCS’s balance sheet structure suggests very low interest risk.
What These Ratios Tell Us Together:
For professional investors, these ratios are not used in isolation. They are read together to assess liquidity, leverage, and financial comfort, helping them judge whether TCS’s balance sheet supports long-term stability and growth.
TCS’s ratios point to:
- Strong liquidity
- Low financial risk
- High balance sheet resilience
This is exactly the kind of financial profile professional investors look for when evaluating long-term, high-quality businesses.
Read: Portfolio Diversification – How Many Stocks Should You Hold? : LINK
While ratios help quantify a company’s financial strength, they are only as reliable as the assumptions behind the numbers — and that’s where the notes to accounts become essential.
Notes to Accounts — The Story Behind the Numbers
“The footnotes are where the bodies are buried.” — Warren Buffett

It’s essential to read the notes because they tell you exactly what is included in the numbers, as well as what’s excluded or might change with different circumstances.
Balance sheet numbers can look strong on the surface, but without notes, they can be misleading. Notes help investors understand:
- Accounting policies used to value assets and liabilities
- Breakups of large line items, such as receivables and liabilities
- Hidden obligations, e.g., lease obligations or contingent obligations
- Assumptions of management regarding depreciation, impairment, and provisions
- In other words, notes give "substance" to the statement.
Experienced Investors don’t read notes line by line. They scan selectively, focusing on areas that carry judgment or risk, such as:
- Revenue recognition and receivable ageing
- Lease obligations and long-term commitments
- Provisions, contingent liabilities, and employee benefits
- Changes in accounting policies compared to the previous year
The objective is not to memorize disclosures but to determine whether the headline numbers reasonably reflect reliable and sustainable figures.
Read Why Promoter Buying is the Strongest Signal in Stock Markets : LINK
After understanding the detailed disclosures in the notes to accounts, it becomes important to assess what these details actually signal for investors by identifying potential green flags and red flags.
What to Look For — Red Flags and Green Flags
“Risk comes from not knowing what you’re doing.” — Warren Buffett
After understanding the balance sheet figures, ratios, and the figures mentioned in the notes, the investor looks for certain patterns from the perspective of professional investors. Here, the investor should never over-analyze the figures but instead look for certain clues.
Red Flags — Signs to Be Cautious
These don't necessarily mean the company is bad, but signal for further investigation:
- Liabilities Growing Faster Than Assets, Which Could Indicate Increased Financial Pressures
- Weak or declining liquidity - If there is weak or declining liquidity, indicated by consistently higher current liabilities than current assets
- Presence of debt without corresponding increases, especially when the business is not capital-intensive.
- Large amount of receivables with slow collections – potential cash-flow problems
Negative or Shrinking Shareholders' Equity, usually reflecting losses over several years or payments to shareholders
These approaches tend to suit long-term investors:
- Strong cash resources and net debt position to maintain financial flexibility
- Stable or increasing liquidity ratios in consecutive periods
- Liabilities that are predominantly operating, as opposed to debt-related
- Consistent growth in retained earnings, indicating profitable investments
- Clear, transparent disclosures should be provided in notes without any major surprises.
How are these signals used by Professionals?
Instead of relying on single red or green flags, investors look at clusters.
While a few red flags might be tolerable, several green flags, over a period of time, tend to point to a good quality business. This approach transforms a preexisting number-crunching exercise into a more meaningful form of decision-making.
Read Common Mistakes made by investors here: LINK
In real-world scenarios, investors and analysts rely on these red and green flags to make informed financial decisions.
Once you know what to watch for—red flags and green flags—the real skill is putting it all together to read a company like a professional investor.
Conclusion
Investors often get tripped up not by the complexity of financial statements, but by how they interpret them. Skimming balance sheets, fixating on headline ratios, or ignoring notes to accounts can give a misleading picture. True insight comes from seeing how the numbers, ratios, and notes together reflect a company’s real financial health.
TCS shows that strong fundamentals aren’t about isolated figures—they emerge from consistency, transparency, and alignment across all statements. Mastering this approach turns basic analysis into informed decision-making, helping investors separate noise from meaningful signals.
If this article helped you understand how to read and interpret real company financials, comment “ANALYSE” below. Like the article to support practical financial learning, share it with peers starting their investment journey, and comment on one insight you gained about evaluating a company’s financial health.
Explore our Products
Research Framework

Emerging Titans
Combination of quantitative analysis, industry tailwinds, and management assessment - SPRINT investment philosophy

Tiny Titans
Heavy emphasis on scuttlebutt research, plant visits, and early on-ground signals
FAQs ( Frequently Asked Questions )
What is a balance sheet and why is it important?
+Should I look at standalone or consolidated balance sheets?
+What are “notes to accounts” and why do they matter?
+How can I use ratios to evaluate a company?
+Can a company with high assets still be risky?
+How often should I review a company’s balance sheet?
+
High growth stock specialist, Value Educator
Shashank Mahajan is an equity research professional with over 12 years of experience in identifying high-potential SME and micro-cap stocks at an early stage. He follows a rigorous scuttlebutt research–driven approach, combining on-ground insights with deep financial analysis. Shashank specializes in uncovering under-researched and under-owned companies with strong management quality and long-term growth potential. Through disciplined research and early identification, he focuses on spotting tomorrow’s market leaders before they enter the mainstream investor radar.

Glenmark: The USD 700 Mn Cancer Deal and Its Brands

Pharma Stocks in India 2026: Generics, APIs and CDMOs

Granules India: From Paracetamol to a 65% Gross Margin

Natco Pharma: After Revlimid, 29 Patent Challenges

Shilpa Medicare: Cancer APIs, Films and Biosimilars

Alembic Pharma: US Plants Pay Back, Margin Hits 22.2%
Explore our Products
Research Framework
Emerging Titans
Combination of quantitative analysis, industry tailwinds, and management assessment - SPRINT investment philosophy
Tiny Titans
Heavy emphasis on scuttlebutt research, plant visits, and early on-ground signals



Modern Warfare to Multibaggers
Key Trends. Strategic Shifts. Opportunities Ahead.
Today at 7:00 PM IST. Room opens 30 minutes before.
Don't Miss This Exclusive Webinar!
Join Value Educator to decode the key trends shaping India's defence sector and learn how to identify tomorrow's potential leaders in the space.
- In-depth research on India's defence sector
- Live Q&A session
- Actionable takeaways for long-term investors

 Orders
 Subscription
 Share with friends


Required Details
₹23999.00
(12 month subscription)
As per SEBI regulations, all users are mandated to complete the KYC that is validated for 1 year. Post payment, you will be redirected to the KYC screen


No comments yet. Be the first to comment!