
How to Analyse a Mid-Cap Company

Most investors don’t lose money in mid-caps due to lack of intelligence or information — they lose money because their thinking has no clear structure.
After tracking 200+ businesses across cycles, one truth stands out: outcomes depend more on the quality of thinking than on data. Without a framework, investors keep jumping between ideas — cheap valuation one day, great story the next, a few good ratios after that — with no order or priority. Over time, this scattered approach leads to poor decisions.
As Malcolm X said,
“If you don’t stand for something, you’ll fall for anything.”
In investing, lack of a framework leaves you vulnerable to narratives, numbers, and price moves.

Mid-caps make this risk bigger.
They look comfortable on the surface — decent financials, exciting growth stories, confident management — yet many underperform later. Across cycles, nearly one-third of mid-caps fall 50%+, even without major business collapse. They don’t crash loudly — they fail quietly.
The problem isn’t lack of information.
Investors today are overwhelmed — annual reports, concalls, ratios, dashboards — but without structure, decisions get driven by comfort stories, short-term price moves, or “cheap” valuations instead of true business understanding.
Mid-caps operate in a delicate transition zone — big enough to attract expectations, but not yet stable enough to be forgiven for mistakes. They expand capacity, enter new markets, hire aggressively, and deploy large capital — with little room for error. A wrong expansion, poor execution, or excess debt hurts them far more than a mature large-cap.
Indian markets offer clear contrasts.
Page Industries (Jockey) grew steadily through discipline — measured expansion, strong cash flows, and patience. Meanwhile, peers like Rupa and Lux chased aggressive growth and branding without equal execution or balance-sheet strength. Same opportunity — different outcomes. Execution quality and financial discipline made the difference.
As Bill Gates said,
“Success is a lousy teacher. It seduces smart people into thinking they can’t lose.”
Mid-caps are where this lesson hurts most — early success often hides future risks.
Successful investing isn’t about more data or spreadsheets.
It’s about
- Identifying quality early,
- Acting when odds are favorable, and
- Letting time do the compounding.
As Thomas Phelps wrote:
“Vision to see, courage to buy, patience to hold — patience is the rarest.”
This framework is built on that mindset — a calm, step-by-step way to judge mid-cap potential, avoid traps, and understand how they truly behave. Before applying it, we must first understand what mid-caps really are — and why they behave differently across cycles.
What Exactly Is a Mid-Cap Company?
The best way to understand a mid-cap is not by market-cap range, but by where the business is in its journey.
Mid-caps sit in a transition zone — no longer fragile startups, but not yet large, stable giants. The model is proven; the real question is whether it can scale without breaking.
This phase is high-action — capacity expansion, new plants, hiring, new markets, and growth initiatives. Decisions made here often shape the next decade.
That’s what makes mid-caps exciting — and risky.
When expansion is rushed, execution is weak, or debt rises too fast, cash flows start feeling the pressure long before the problem shows up in the financials. But when a company grows carefully and allocates capital with discipline, a mid-cap can slowly evolve into a long-term compounding business.
In India, this pattern is common across manufacturing, consumer, and niche services — some companies emerge stronger, others collapse under over-ambition.
Recognizing this transition phase is the true starting point of mid-cap analysis — these businesses behave very differently from both small-caps and large-caps, and require a calm, structured approach.
Why Mid-Cap Analysis Is Different
Mid-caps can’t be analyzed like large-caps — using the same mindset is dangerous.
Large-cap analysis focuses on stability and predictability. Mid-caps, however, are still learning how to scale sustainably — and promoter decisions matter far more. One wrong expansion, acquisition, or leverage call can change the company’s future.
That’s why the balance sheet matters more than headline profits. Earnings may look strong — but rising debt and weak cash flows can break a company in a downturn.
Investors also fall into a behavioral trap — overestimating certainty and underestimating execution risk. A stock may look cheap and the story convincing, yet weaknesses in operations, capital allocation, or governance can destroy the thesis quickly.
Indian markets have shown this repeatedly — companies like Reliance Naval and IL&FS-linked entities looked attractive on paper until governance issues and debt mismanagement unraveled them.
This gap between what appears strong and what is real is exactly why mid-caps demand a structured framework for analysis.
Step 1: Business Quality
The first question is simple but powerful: Is this a good business?
Before you look at numbers, you should first be able to explain what the company does in one or two simple sentences. If that feels difficult, treat it as an early caution sign.
Start with the basics — what does the company sell, and who is the real customer?
Is demand:
- Repeat and recurring → more stability
- Dependent on one-off projects or contracts → more volatility
- Next, check pricing power.
Can the company pass on higher costs without losing customers? If yes, it has an edge. Commodity businesses usually struggle here because competition keeps prices under pressure.

You can use a few simple metrics — especially gross margin trends:
- Are margins stable, improving, or declining?
- How do margins compare with direct peers?
Always compare companies with their industry peers. Higher margins and better efficiency versus competitors often point to a durable edge — especially for niche product manufacturers compared to commodity players.
A strong business foundation matters — but it’s not enough by itself. Numbers show that growth happened, but they don’t explain how it happened.
That’s where Value Educator’s scuttlebutt approach becomes important — validating ground reality before trusting reported performance.
Only after this on-ground understanding is clear should you move to the next step — assessing growth visibility.
Step 2: Growth Visibility
Once the business looks solid, the next question is: Where will growth come from?Mid-caps often talk about expansion — but not all growth is real or sustainable.
Start by reviewing capacity expansion plans:
- Are they adding plants, new lines, or new geographies?
- Is there genuine demand to justify it?
Expansion without demand can backfire.
Also assess what is driving growth:
- Is the industry itself growing?
- Or is the company gaining market share?
Market-share-led growth is stronger than growth that merely rides an industry boom.
A few simple checks help validate growth:
- Review revenue trends across multiple years, not just one strong year.
- Look at capacity utilization — are new assets being used efficiently?
Expansion usually makes sense when plants are already operating at 70–80% capacity, not when they’re half empty.
Growth without visibility is just hope. Some companies expand on optimism; disciplined companies expand when demand visibility is clear — and that difference shapes long-term outcomes.
For example, Astral and Deepak Nitrite scaled capacity only after demand strengthened — turning expansion into sustained earnings instead of balance-sheet stress.
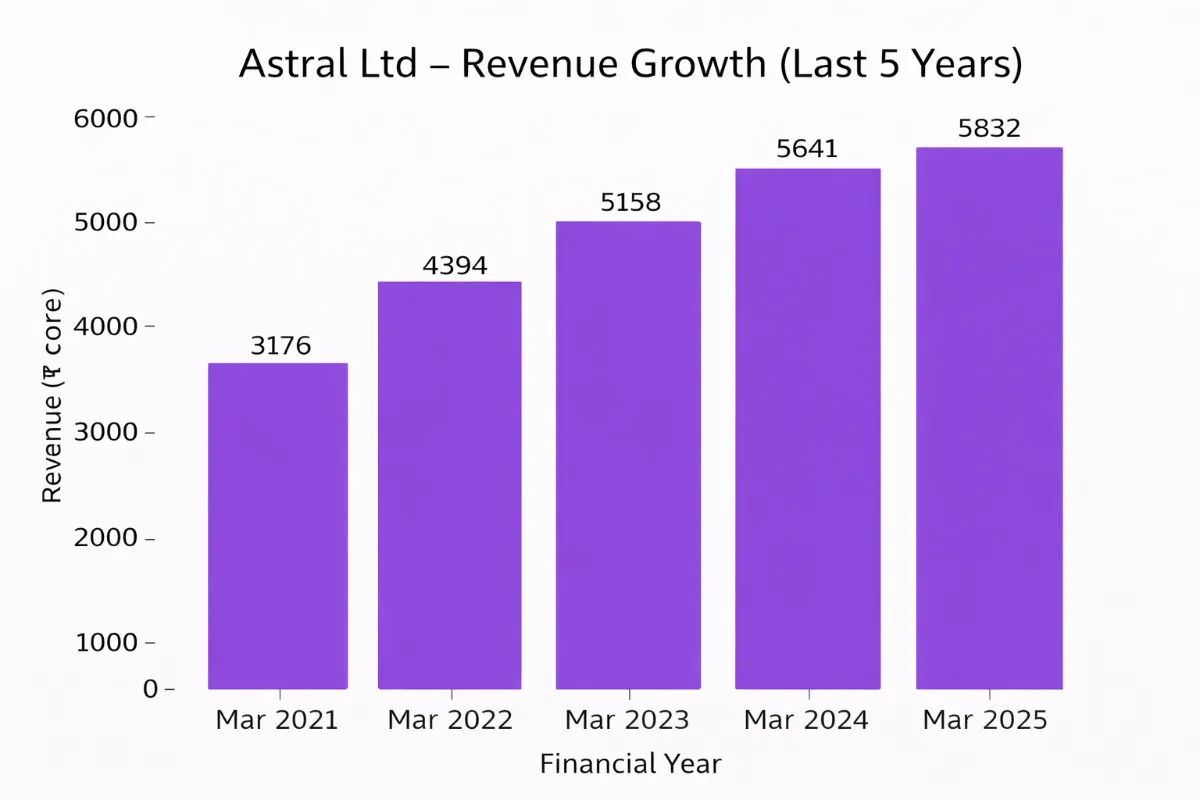
“Hope is not a strategy.” — Rudy Giuliani
But even the best growth story works only if the balance sheet can support it — and that’s where the next step becomes crucial: evaluating financial strength.
Step 3: Financial Strength – Balance Sheet & Cash Flows
Once you understand what the business does and how it plans to grow, the real question to ask is simple:
Can this company survive a bad year?
Strong products and attractive growth stories mean little if the finances are weak. In mid-caps, fragile balance sheets can turn small setbacks into permanent damage.
Begin by seeing how growth is being funded:
- Is it financed through internal cash flows?
- Or dependent heavily on debt?
Debt can boost growth in good times — but becomes a major risk during slowdowns. Many companies don’t fail because demand disappears — they fail because cash runs out.
Working capital discipline is equally critical. If too much money is stuck in inventory or receivables, reported profits may look fine while cash flow weakens underneath.
That’s why cash flow must always be viewed alongside profits.
Rising earnings mean little unless they are supported by consistent operating cash flow — that’s what proves profits are real, repeatable, and capable of funding future growth.
Astral Ltd. Net Profit Vs. Operating Cash Flow
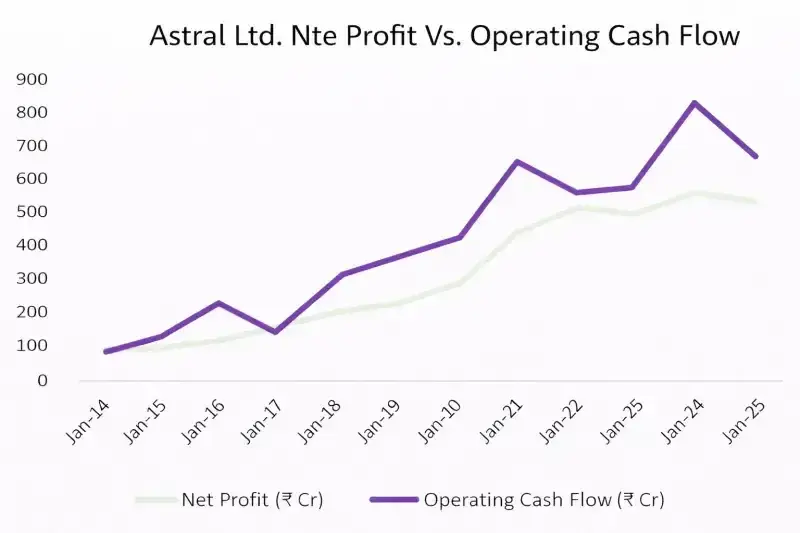
Astral is a classic example of financial strength done right. Over the years, its operating cash flows have largely moved in line with — and at times even exceeded — reported profits. That tells you two important things: the company converts profits into real cash, and most of its growth is being funded internally rather than through aggressive borrowing. In difficult years, businesses like these may slow down — but they don’t break.
In contrast, businesses where profits rise but cash flows weaken often struggle when conditions turn — because the risk is already hidden in the balance sheet.

Sintex Industries shows why this step matters. For years, profits looked strong on paper — but cash flows were inconsistent. Expansion was increasingly funded through debt instead of internal cash generation. When conditions weakened, the balance sheet couldn’t absorb the shock — and what looked like a growing mid-cap eventually collapsed.
Jet Airways followed a similar pattern. Revenues and reported profits appeared stable, but operating cash flow wasn’t enough to cover core expenses like leases, fuel, and salaries. The business survived on short-term borrowing and delayed payments. Once lenders tightened funding, liquidity dried up — and the company unraveled despite appearing operational.
The lesson is simple:
Profits show success — but cash shows survival.
A few simple checks reinforce this:
- Track net debt — is it rising or reducing?
- See whether operating cash flow keeps pace with profits over time.
You don’t need complex models — direction and consistency in cash generation reveal most of the story.
Many once-promising companies — Sintex, Jet Airways, Amtek Auto, Sintex Plastics, and others — didn’t fail overnight. They failed because debt-fuelled growth left no margin for error.
As Charles Darwin said:
“It’s not the strongest who survive, but the ones most responsive to change.”
Numbers tell you what has already happened. The next step — understanding management discipline and governance behavior — helps you assess what is likely to happen next.
Step 4: Management & Governance
Once the numbers look sensible, the next question is: Can I trust the people running this business?In mid-caps, management quality often matters more than ratios or growth numbers.
Start by examining promoter behavior:
- Do they have meaningful skin in the game?
- Have their actions historically aligned with shareholder interest?
A consistent track record builds trust, while frequent shifts in strategy or ownership are early warning signs.
Next, review capital allocation history.
The final — and often most revealing — question is how management has used profits and debt over the years. Companies that reinvest steadily in their core business and expand only when economics justify it usually create far more value than those chasing diversification, acquisitions, or flashy expansion.
Examples like Havells and Bajaj Finance illustrate this well — both stayed focused on their core franchises, allocated capital patiently, and communicated transparently with investors during their mid-cap years, which helped build credibility long before the market rewarded them.
Examples like Havells and Bajaj Finance show how disciplined allocation and clear communication built long-term trust during their mid-cap phase.
Transparency is equally important.
Clear disclosures and straightforward explanations in concalls and reports indicate responsible leadership. Vague commentary, inconsistent reporting, or reluctance to share information are red flags that shouldn’t be ignored.
The hard truth is — a single governance lapse can destroy years of compounding. Even a strong business can disappoint if decisions are flawed or expectations unrealistic.
As Abraham Lincoln said:
“Nearly all men can stand adversity, but if you want to test a man’s character, give him power.”
Once management quality is assessed, the final step is to evaluate whether the current price reflects the company’s true potential — valuation and expectations.
Step 5: Valuation & Expectations
After analyzing the business, growth, finances, and management, the final question is: What am I really paying for?Valuation shouldn’t be the first step — but it is the final filter that decides whether the stock is worth owning.
Focus on valuation relative to growth.
A company may be fundamentally strong, but if the price already assumes perfect execution, risk is high. Compare valuations with direct peers, not the entire market, to understand what investors are pricing in.
Ask yourself:
- What needs to go right for returns to play out?
If too many variables — demand, execution, or margins — must be flawless, your margin of safety is low, even in a great company. Many mid-caps trade at 30–40x earnings with only mid-teens growth, leaving little room for error.
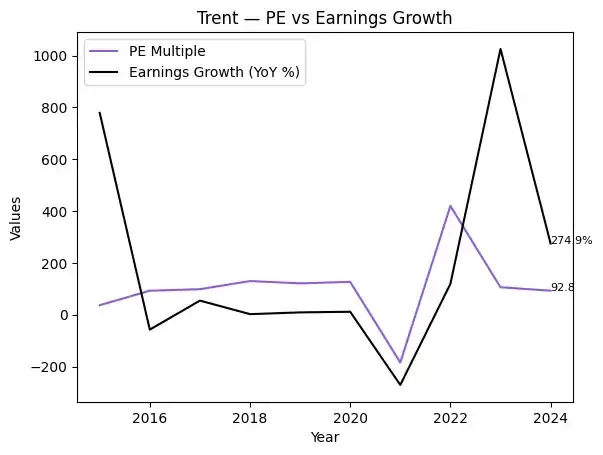
This chart compares Trent’s PE multiple (purple line) with its earnings growth CAGR (black line) from 2015–2024.
In the early years, PE rose steadily while earnings growth stayed modest. In 2021, earnings fell sharply into negative territory — but the PE multiple still spiked, showing that investors were pricing in future recovery rather than current profits. In 2022–2023, earnings rebounded strongly, and PE remained elevated. By 2024, earnings growth cooled off, and the PE multiple moderated — but was still higher than the earlier years.
Simple takeaway: Trent’s valuation has often moved ahead of earnings — meaning the market priced in future growth early, especially during recovery phases.
Ratios like PE or EV/EBITDA are useful as sanity checks — not precision tools. The objective is to understand expectations, not derive exact target values.
Core takeaway:
Overpaying compresses future returns — even in excellent businesses.
Valuation is about setting realistic expectations, not assuming perfection.
Final Industry Comparison Check
Before taking a final call on any mid-cap, step back and compare it with its closest peers. The goal isn’t perfection — it’s to see whether the company truly stands out, or only looks good in isolation.Ask a few simple questions:
- Is the business structurally stronger than peers?
- Is its growth more visible and repeatable?
- Does the balance sheet look healthier?
- Has management shown better capital-allocation discipline?
- Are valuations and expectations reasonable versus competitors?
You may support this with light checks like gross margins, ROCE, and debt levels — but avoid over-analyzing. This is a thinking filter, not a spreadsheet exercise.
Interpret the answers honestly:
- 4–5 “yes” → strong candidate, worth deeper work
- 2–3 “yes” → proceed cautiously; risk–reward is balanced
- 0–1 “yes” → better to walk away, however attractive the story sounds
This step helps separate mid-caps with real long-term potential from those that only look good on paper.
As Peter Drucker said, “The best way to predict the future is to prepare for it.”
The companies that prepare well compound quietly — the rest fade despite similar starting numbers.
And just as preparation helps identify opportunities, it also guides when to step away — which leads to the next part of mid-cap investing: knowing when to exit.
When Should You Exit a Mid-Cap Company?
Most investors focus heavily on when to buy — but think far less about when to exit. In mid-caps, exits matter just as much as entries, because risk usually builds gradually before it shows up in the price. A disciplined investor doesn’t exit out of fear — they exit when the risk–reward equation turns unfavorable.Here are the five most important exit triggers:
1) Thesis Breakdown — The Original Reason No Longer Holds
A mid-cap thesis is built on growth visibility, execution discipline, or industry tailwinds. When those pillars weaken, it’s a major warning sign.Watch for:- Growth visibility disappears or becomes uncertain
- Strategy shifts without clear explanation
- Execution consistency deteriorates
If the reason you bought the stock no longer exists, the thesis is broken. Holding after that point isn’t conviction — it’s attachment.
2) Valuation Excess vs Better Opportunities
Sometimes the business is still good — but the price stops making sense.Signals:
- Valuation assumes perfection
- Growth slows but valuation keeps expanding
- Similar or stronger peers are available cheaper
When valuations stretch faster than fundamentals, exiting and reallocating is portfolio discipline, not impatience.
3) Balance Sheet Deterioration — The Silent Red Flag
Income statements may still look fine while risk builds underneath.
Watch:
- Debt rising faster than earnings
- Operating cash flow lagging reported profits
- Working capital stretch widening
Mid-caps rarely collapse because of earnings —
they collapse when the balance sheet runs out of breath.
Exit before the market starts pricing it in.
4) Management Behavior Shifts
Numbers change late — behavior changes early.Red flags:
- Sudden rise in related-party deals
- Unrelated diversification / empire-building
- Promoter pledging increases
- Repeated dilution without strong logic
Governance risk compounds faster than returns.
When trust erodes, step back.
5) Structural Industry Shift or Competitive Disruption
Even strong companies struggle when industry economics change.Signals:
- A dominant competitor scales rapidly
- Technology or pricing disruption
- Structural margin / pricing power erosion
When the industry itself weakens, execution alone can’t offset pressure — exiting is realism, not doubt.
Exit Is Not Panic — It Is Re-Allocation
A professional investor exits when:- Upside reduces
- Downside risk rises
- Capital can work harder elsewhere
Exit isn’t panic selling —
it’s disciplined re-allocation when risk–reward turns negative.
Explore our Products
Research Framework

Emerging Titans
Combination of quantitative analysis, industry tailwinds, and management assessment - SPRINT investment philosophy

Tiny Titans
Heavy emphasis on scuttlebutt research, plant visits, and early on-ground signals
Conclusion: Think in Frameworks, Not in Stock Tips
Mid-cap investing isn’t about stories or cheap-looking prices — it’s about knowing where a business is in its journey, whether it can scale without breaking, and whether management can compound capital through cycles. This framework keeps analysis in the right order — business quality → growth visibility → financial strength → management behavior → valuation & expectations — helping avoid emotional decisions and execution-risk blind spots. Not every mid-cap becomes a compounder, but this approach reduces avoidable mistakes and helps you walk away when risk quietly outweighs reward.If this framework helped you see mid-caps more clearly — comment “FRAMEWORK” below.
Like the post if you want more research-driven breakdowns, share it with investors who chase stories over structure, and tell me — which step in this framework changed the way you evaluate mid-cap companies?
Successful mid-cap investing doesn’t reward speed — it rewards clarity, discipline, and the courage to think in frameworks instead of stock tips.
Mid-Cap Investment Checklist — One-Page Summary
This checklist is designed to help you apply the framework in a clear, practical, and repeatable way while evaluating any mid-cap company.Use it as a quick filter before diving deeper.
Business Quality
- Demand is repeat in nature (not purely project-based)
- Company has some pricing power in its category
- Gross margins are stable or improving
- Business performance is superior vs direct peers
- Scuttlebutt confirms real-world demand & execution
Growth Visibility
- Growth is backed by real demand — not hope or guidance
- Capacity utilization ~70–80% before expansion
- Expansion is phased — not aggressive or rushed Industry tailwinds or market-share gains visible Past execution on growth projects is reliable
- Industry tailwinds or market-share gains visible
- Past execution on growth projects is reliable
Financial Strength (Balance Sheet & Cash Flow)
- Net debt trend is stable or reducing
- Operating cash flows broadly track reported profits
- Working capital cycle is not stretching over time
- Interest burden is manageable across cycles
- Business can survive a weak year without stress
Management & Governance Discipline
- Promoters have meaningful skin in the game
- Capital allocation track record is sensible
- No unrelated diversification or empire-building
- Disclosures and concall commentary are transparent
- Governance behaviour inspires confidence
Valuation & Expectations
- Valuation is reasonable vs growth & peers
- Current price does not assume perfect execution
- Earnings visibility supports the multiple
- Return potential justifies downside risk
- Margin of safety is adequate
Decision Guide
- 4–5 boxes tick confidently → Strong candidate → Proceed to deeper research
- 2–3 boxes tick → Mixed outcome → Stay cautious & track closely
- 0–1 boxes tick → High risk → Walk away — no matter how attractive the story sounds
FAQs ( Frequently Asked Questions )
How to identify mid-cap companies?
+How to properly analyze a company?
+How do I pick the right mid-cap stocks?
+Where can I research mid-cap stock performance?
+Which are the top 10 midcaps?
+
High growth stock specialist, Value Educator
Shashank Mahajan is an equity research professional with over 12 years of experience in identifying high-potential SME and micro-cap stocks at an early stage. He follows a rigorous scuttlebutt research–driven approach, combining on-ground insights with deep financial analysis. Shashank specializes in uncovering under-researched and under-owned companies with strong management quality and long-term growth potential. Through disciplined research and early identification, he focuses on spotting tomorrow’s market leaders before they enter the mainstream investor radar.

Glenmark: The USD 700 Mn Cancer Deal and Its Brands

Pharma Stocks in India 2026: Generics, APIs and CDMOs

Granules India: From Paracetamol to a 65% Gross Margin

Natco Pharma: After Revlimid, 29 Patent Challenges

Shilpa Medicare: Cancer APIs, Films and Biosimilars

Alembic Pharma: US Plants Pay Back, Margin Hits 22.2%
Explore our Products
Research Framework
Emerging Titans
Combination of quantitative analysis, industry tailwinds, and management assessment - SPRINT investment philosophy
Tiny Titans
Heavy emphasis on scuttlebutt research, plant visits, and early on-ground signals



Modern Warfare to Multibaggers
Key Trends. Strategic Shifts. Opportunities Ahead.
Today at 7:00 PM IST. Room opens 30 minutes before.
Don't Miss This Exclusive Webinar!
Join Value Educator to decode the key trends shaping India's defence sector and learn how to identify tomorrow's potential leaders in the space.
- In-depth research on India's defence sector
- Live Q&A session
- Actionable takeaways for long-term investors

 Orders
 Subscription
 Share with friends


Required Details
₹23999.00
(12 month subscription)
As per SEBI regulations, all users are mandated to complete the KYC that is validated for 1 year. Post payment, you will be redirected to the KYC screen


No comments yet. Be the first to comment!