
How High-ROE Small Caps Left Penny Status

People buy penny stocks mostly because they want something fast. It’s cheap, so they tell themselves maybe one day it will shoot up. For a while, it feels exciting. Usually, though, nothing changes, and the whole idea just quietly disappears.
“The biggest risk is not taking enough risk — but taking the wrong kind of risk.”
— Howard Marks
The uncomfortable reality is this: wealth is rarely created while a stock is a penny stock. Real compounding begins only after a company earns credibility, fixes its fundamentals, and stops being cheap for the wrong reasons. That phase isn’t dramatic. It’s slow, uneventful, and easy to ignore — which is exactly why most people miss it.

This is where high ROE starts to catch attention. It looks convincing and feels like confirmation that something special is happening. But ROE by itself isn’t a guarantee. It’s only a signal, and signals matter only when you understand what’s driving them underneath the surface.
This article looks at small companies that managed to cross that invisible line. They didn’t become successes overnight. They improved gradually — through better execution, steadier cash flows, and growing trust — until the market was forced to reprice them. The real lesson isn’t about buying cheap stocks. It’s about spotting when a business begins to mature.
What follows is not a list of stock ideas. It’s a way of thinking. We’ll first clear the confusion around what “penny stocks” actually represent, then explain why ROE attracts investors, and finally explore how a few companies evolved while most stayed stuck.
Before we talk about ROE, execution, or graduation, it’s important to clear one basic misconception that distorts almost every small-stock discussion. Many investors think they understand penny stocks simply by looking at the share price. That assumption is where most mistakes begin.
To understand how the Indian stock market works from the ground up, you can read A Beginner's Guide to the Indian Stock Market. With that foundation in place, we can now define what a “penny stock” actually represents — beyond the number printed on the screen.
What Is a “Penny Stock” — Really?
A penny stock isn’t really about the share price. That’s where most people get it wrong. A stock trading at ₹10 can be fragile and overpriced, while a ₹500 stock can still act like a penny stock if the business itself is unstable and unreliable.
In reality, penny stocks are usually small businesses with weak credibility and uneven earnings. Revenues move around, profits don’t last, and investors can’t see very far ahead. The low share price is simply the market’s way of reflecting that uncertainty.
To go deeper into what penny stocks actually are, along with their risks and misconceptions, you can read What are penny stocks? The complete beginner's guide: pros & cons.
As this uncertainty starts to fade, everything begins to change. Cash flows stabilize, execution becomes visible, and results stop swinging wildly. Confidence builds slowly, not overnight.
A company stops being a penny stock when its business becomes predictable.
“Time is the friend of the wonderful business, the enemy of the mediocre.”
— Warren Buffett
The real graduation moment comes when one-year earnings stop being the key driver, and two-to-three-year visibility becomes possible. At this stage, the market no longer debates survival or the next quarter. It starts by debating scalability, sustainability, and return on capital.
To learn how investors identify this transition early, you can read 7 Early Signals That a Stock Can Turn Multibagger.
“The real money is made by staying invested in the right companies, not by trading in and out.” — Peter Lynch
Once a business reaches this stage, the conversation inevitably changes. Investors stop asking whether the company will survive and start asking how efficiently it can grow with the capital it already has.
That is where return ratios quietly enter the discussion — not as headlines, but as confirmation. And among them, one metric draws attention faster than any other.
Why High ROE Attracts Investors — and Why It Can Mislead
Return on Equity (ROE) is one of the most popular metrics in investing because it appears simple and intuitive. It measures how efficiently a company uses shareholders’ capital. If investors put ₹100 into a business and the company earns ₹20, the ROE is 20%. Naturally, this feels like evidence of strong management and a high-quality business.

“Over the long term, it’s hard for a stock to earn much more than the business earns.” — Charlie Munger
That perception explains why high-ROE companies attract attention. A consistently high ROE often signals profitability, efficiency, and disciplined capital allocation. Over long periods, businesses that generate superior returns on capital tend to create meaningful shareholder wealth.
The problem is that ROE is an outcome, not an explanation. A high ROE does not automatically mean the business is strong or improving. It can rise for reasons that have little to do with operational excellence.
The DuPont framework helps clarify this. ROE is driven by three components: profit margins, asset efficiency, and financial leverage. A company may show an impressive ROE because margins are strong and assets are productive, or simply because debt has reduced the equity base. The number looks identical, but the risk profile is entirely different.
Viewed in isolation, ROE answers only a limited question: what return did shareholders receive this year? It does not reveal whether those returns are durable. Temporary tailwinds, favourable cycles, or leverage can all inflate ROE without improving the underlying economics.
This distinction is critical, particularly when evaluating smaller or formerly speculative companies. Sustainable ROE expansion usually follows real improvements in execution, efficiency, and cash flows. When the foundations remain weak, high ROE often proves fleeting.
The most reliable signals appear when returns improve after the business strengthens — not before. That is the shift worth paying attention to.
CASE STUDY – Tara Chand InfraLogistic Solutions
ROE driven by execution, not compounding
Tara Chand InfraLogistic Solutions operates in a part of India’s infrastructure ecosystem that most investors never see. It does not build bridges, sell cement, or manufacture steel. Instead, it enables these activities to happen. The company provides heavy construction equipment on rent, executes specialized infrastructure works, and manages steel warehousing and logistics for some of India’s largest industrial and public-sector clients. Its revenues are not generated by selling products, but by deploying capital assets efficiently and continuously over long periods of time.
The business runs on two main engines. The first, and the more profitable one, is construction equipment rental and infrastructure execution. This includes cranes ranging from 50 tonnes to 800–900 tonnes, piling rigs used for deep foundation work, aerial platforms that operate above 25–30 metres, trailers, and other specialized equipment. These machines are used across metro and high-speed rail projects, steel and cement plants, oil and gas sites, power projects, and increasingly renewable energy installations.

The second engine is steel warehousing and logistics. Here, the company operates yards and handles activities such as loading, unloading, stacking, security, and transportation of steel for both PSU and private steel producers. This business is paid based on the volume of steel handled, not on steel prices, which makes it linked to throughput rather than commodity price movements.
For a long period, even though it owned real assets and worked with well-known clients, Tara Chand traded like a penny stock. Between FY19 and FY21, revenues stayed stuck in the ₹100–115 crore range, but profits moved around from year to year. The problem wasn’t lack of work; it was utilisation and visibility. Heavy equipment keeps depreciating whether it is deployed or not. During monsoons, project delays, or periods of slower capex, machines would remain idle, margins would shrink, and return ratios would swing. Finance costs were significant, depreciation was unavoidable, and cash flows were hard to predict. From an investor’s point of view, it was a business that functioned, but one that could not be forecast with confidence.
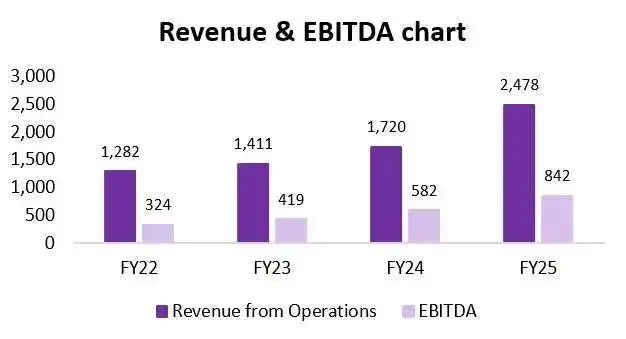
The transition away from penny-stock behaviour began when the company changed how it participated in projects. Instead of acting as a short-term equipment supplier, Tara Chand increasingly positioned itself as an execution partner. Machines were deployed for multi-month or multi-year engagements, embedding the company deeper into project sites. This reduced idle time, improved billing visibility, and made Tara Chand operationally harder to replace once work had begun. Critically, capital expenditure became contract-backed. New equipment was purchased only when management had visibility on deployment beyond the first project, reducing the risk of stranded or under-utilised assets.
This shift coincided with deliberate sector diversification. A few years earlier, deployment was more concentrated around infrastructure projects. Over time, exposure expanded across steel, cement, oil & gas, power, and renewables. Today, no single sector dominates fleet deployment. This diversification allows equipment to be redeployed when activity slows in one area, supporting fleet utilization levels of roughly 80–85%, which is considered optimal in this industry. Pan-India operations across more than 20 states and dozens of live sites further enhance redeployment flexibility.
What ends up protecting the business is how difficult it is to run day to day. Handling hundreds of machines across different sites is not clean or smooth. People have to be trained, machines need attention all the time, and moving equipment around without delays is a task on its own. On top of that, safety can’t slip. Large cranes, piling rigs, and high-reach platforms cost a lot, are mostly imported, and come with real operating risk. That keeps many smaller players away. Buying equipment is only the starting point. Running it consistently, without letting machines sit idle or margins fall, is what really makes the difference.
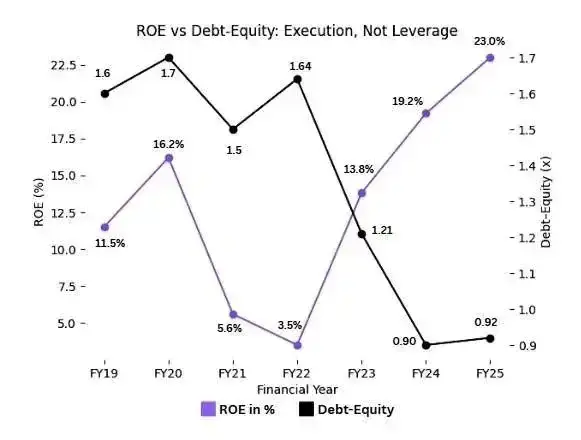
From FY22 onward, these changes began to reflect in financials. Revenue growth accelerated and, more importantly, margins stabilised as utilisation improved. EBITDA expanded meaningfully without the business becoming asset-light. In fact, the gross block increased as the company invested in larger and more specialised equipment. The difference was that incremental capital began generating proportionately higher returns.
Returns followed as the business stabilised. ROE, which had been around 12% a few years earlier, gradually moved up to about 19–20% by FY25. This improvement was supported by tighter balance-sheet control. Debt-equity came down from roughly 1.6x to below 1x, interest coverage improved meaningfully, and borrowing costs eased to around 8–9%. Strong relationships with banks and the use of secured structures helped Tara Chand fund capex at rates lower than most peers, which matters in an asset-heavy business. With finance costs under control, gains at the operating level translated cleanly into net profit.
Cash flows validated the earnings quality. Operating cash flow rose sharply, and receivable days declined from around 150 days to the 75–85 day range. Improved working-capital discipline reduced reliance on short-term borrowing and strengthened liquidity. Meanwhile, the steel warehousing and logistics segment—though lower margin—provided a stabilising cash-flow base due to its volume-linked, long-term contracts, offsetting some cyclicality in equipment rentals.
By FY24–FY25, Tara Chand no longer resembled a penny stock in economic terms. Earnings became more predictable, capital allocation more disciplined, and management communication more conservative and execution-focused. Growth guidance shifted toward sustainability rather than excitement. The market’s perception adjusted accordingly, and the stock’s re-rating followed improvements in business quality and financial resilience—not speculation.
That said, the limits of this transformation are important to acknowledge. Tara Chand is not a classical compounding business. Its ROE is execution-led and conditional. The business remains asset-heavy, depreciation remains high, and returns depend on maintaining utilisation and controlling working capital. A slowdown in infrastructure capex, prolonged project delays, or sector-specific weakness can compress margins and ROE quickly. Unlike businesses with pricing power or brand moats, Tara Chand must earn its returns continuously through disciplined execution.
The real lesson from Tara Chand’s journey is subtle but powerful. The company did not become credible because ROE improved. ROE improved because the business became predictable, diversified, and better executed. This is how a penny stock graduates into a respectable small-cap business—not by chasing growth, but by fixing the engine underneath.
For a broader perspective on how small and micro-cap companies evolve across sectors, you can read Penny Stocks vs Small Caps – What’s the Difference and Which Is Better?
CASE STUDY – Praveg
ROE driven by business model change, not financial leverage
Praveg began as a small event management and exhibition services company, operating largely in Gujarat and catering to government exhibitions, conferences, and promotional events. For most of its early listed life, the business was modest in scale and episodic in nature. Revenues depended on event calendars, government spending cycles, and one-off contracts. Between FY17 and FY19, annual revenues stayed largely in the ₹25–30 crore range, while profitability remained thin and inconsistent. Despite being operationally sound, the company lacked a scalable and predictable earnings engine, which is why the market treated it like a typical penny stock.
The first meaningful inflection point came in FY20. Praveg reported revenues of approximately ₹60 crore and profit of about ₹3.6 crore. However, this was not yet a structural transformation. The business was still largely dependent on exhibitions and events, and the sustainability of earnings remained uncertain. COVID in FY21 reinforced this vulnerability, as revenues declined to about ₹45 crore. At this stage, the company was still perceived as cyclical, fragile, and dependent on discretionary spending.

The real shift started when Praveg deliberately moved away from pure event management and into experiential hospitality. The focus was on destination-based tented resorts, run under long-term arrangements with state tourism authorities. The structure was simple but effective. Land came from government bodies, while Praveg invested in temporary yet high-quality infrastructure and handled operations end to end. This approach kept the model asset-light, while still giving the company operational control, which changed both capital requirements and return behaviour.
By FY21, even with COVID disruptions, the impact of this shift became visible. Praveg reported profit after tax of around ₹10.8 crore, a sharp improvement compared to pre-COVID years. This came from better operating efficiency and the early success of hospitality assets like Tent City Narmada and White Rann Resort. These properties showed strong occupancy and healthy per-day realisation during peak seasons. More importantly, they produced cash flows that were far more stable and predictable than the company’s earlier event-based contracts.
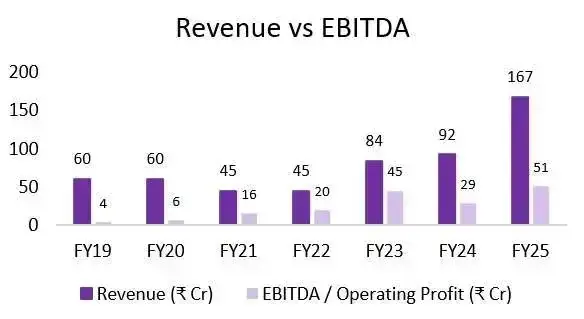
Between FY22 and FY24, the company scaled this model aggressively but selectively. New hospitality destinations were added across Gujarat, Daman, Diu, Ayodhya, and other tourist locations. Revenues rose steadily, crossing ₹90 crore in FY24, while EBITDA expanded at a faster pace due to operating leverage. Fixed costs at each property remained limited, while incremental revenue flowed meaningfully to the bottom line during peak seasons.
By FY25, the transformation was unmistakable. Consolidated revenues crossed ₹170 crore, while profit after tax reached approximately ₹16 crore. EBITDA exceeded ₹55 crore. Net worth expanded sharply, reflecting retained earnings rather than dilution-driven growth. Return on equity improved materially, moving into the high-teens to low-20s range, despite ongoing expansion. Crucially, this ROE expansion was not driven by leverage. Finance costs remained controlled, and the business continued to operate with moderate debt relative to cash generation.
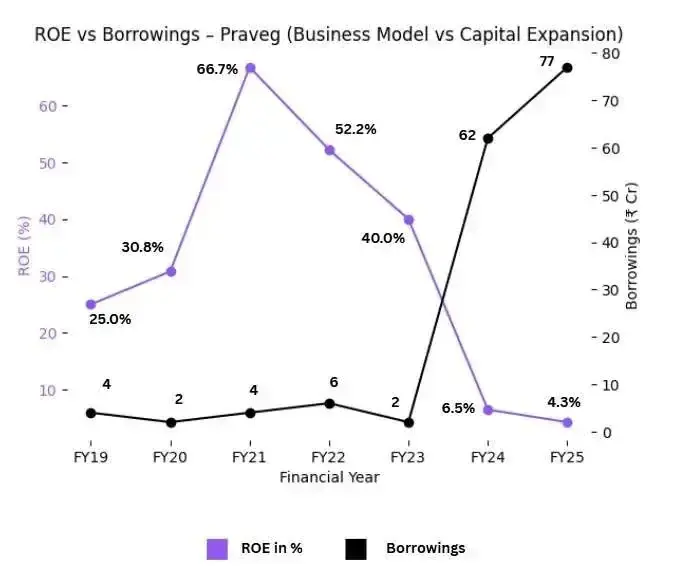
What differentiated Praveg’s ROE profile from typical small-cap spikes was visibility. Unlike event revenues, hospitality operations provided multi-year operating control, recurring seasonal demand, and repeat customer inflows. Occupancy rates, average room realizations, and operating margins became measurable and forecastable. As predictability improved, the market’s perception of risk declined.
This period marked Praveg’s graduation from penny-stock behavior to a quality small-cap profile. Earnings volatility reduced, capital allocation became clearer, and management communication shifted toward long-term asset planning rather than short-term order wins. The stock’s re-rating followed the business transition — not the other way around.
That said, Praveg is not a traditional hotel chain with perpetual assets. Its model still depends on tourism cycles, government partnerships, and seasonal demand. ROE can compress if occupancy weakens or expansion outpaces execution. However, the key distinction is that returns today are anchored in a repeatable operating framework, not one-off events or accounting leverage.
The core lesson from Praveg’s journey is that high ROE was not the starting point of quality. The business first became predictable, scalable, and cash-generative. ROE emerged as the outcome of that transition. This is precisely how a former penny stock stops behaving like one — not by chasing growth, but by fixing the engine underneath.
And because patience alone is not a strategy, long-term investors need a clear way to judge whether “nothing happening” is a sign of quiet progress — or a warning that the business is going nowhere.
High-Quality ROE vs Illusionary ROE
Not all high ROE tells the same story. Two companies can report similar return numbers and still be on completely different paths. The difference lies not in the percentage, but in where that ROE comes from.
High-quality ROE is built from the business itself. It improves when a company fixes its operating model, gains predictability, and earns the right to reinvest capital at healthy returns. In Praveg’s case, ROE expanded after the company moved away from one-off events toward repeatable hospitality operations. Earnings became seasonal but visible, margins stabilised, and capital deployed at each project began generating returns over multiple years. ROE here is the result of a better business, not a temporary outcome.
Illusionary ROE, on the other hand, often comes from favourable conditions rather than structural strength. In execution-heavy businesses like Tara Chand, ROE rises when utilisation improves, projects flow smoothly, and the cycle is supportive. This ROE is real, but fragile. It depends on continuous execution and external momentum. A slowdown, delayed payments, or idle assets can compress returns quickly, even if management does everything right.
The same distinction appears when you look at margins. Sustainable margins are earned when a company controls the experience, the customer relationship, or the operating model. They don’t spike overnight, but they don’t collapse easily either. Temporary margins expand during strong demand phases, high utilisation periods, or cost tailwinds — and shrink just as fast when conditions normalise.
Pricing power separates the two even further. Businesses with high-quality ROE can protect returns without chasing volumes. They don’t need to work more hours or take riskier projects to maintain profitability. In contrast, volume-dependent businesses must constantly push throughput higher to defend ROE. The moment volume slows, returns feel the pressure.
This is why high ROE should never be admired in isolation. The number looks the same, but the behavior underneath is different. One compounds quietly as the business matures. The other performs well only as long as execution and cycles cooperate.
If there is one takeaway to remember, it’s this:
High ROE doesn’t matter unless the business can protect it when conditions turn.
To understand why time matters more than timing in wealth creation, you can read The Power of Compound Interest: How to Create Wealth in the Stock Market.
Yet despite this being one of the simplest truths in investing, it is also one of the most consistently ignored. Not because the data is unavailable, but because investor behaviour rarely aligns with long-term thinking — especially when numbers start looking attractive.
Why Most Investors Get This Wrong
Most investors don’t lose money because they can’t read numbers. They lose money because they read them at the wrong time. High ROE starts showing up clearly only after the hard work is already done. By the time it looks impressive on the screen, expectations are high, narratives are polished, and the easy part of the journey is often behind.
A common mistake is buying after ROE peaks, not when it starts improving. Investors react to what is visible, not to what is changing underneath. When ROE jumps sharply, it creates confidence. When confidence spreads, prices rise. And once prices rise, many assume quality has arrived — even if the business hasn’t truly stabilised.
“Most people overestimate what they can do in one year and underestimate what they can do in ten years.”— Bill Gates
This is where price action gets confused with business progress. A rising stock feels like validation, so risks are ignored. Temporary improvements are mistaken for permanent change. Execution-driven gains are assumed to be compounding gains. In reality, the business may still be fragile, even if the chart looks strong.
The deeper problem is psychological. Greed almost always beats patience. Investors prefer exciting stories over slow evidence. They want movement, announcements, and visible wins. The phase where businesses quietly fix operations, clean balance sheets, and build predictability feels boring — and boredom is uncomfortable in markets.
That’s why the most difficult part of investing isn’t buying or selling.
The hardest part is holding when nothing is happening.
And because patience alone is not a strategy, long-term investors need a clear way to judge whether “nothing happening” is a sign of quiet progress — or a warning that the business is going nowhere.
A Simple Way to Look at High ROE Small Stocks
High ROE looks attractive, but it’s easy to get fooled by it. What matters is not the number itself, but where it comes from.
First, ask why ROE is high. Is the business actually better — stronger demand, better pricing, repeat customers? Or is ROE being pushed up by debt, a good cycle, or temporary cost savings? Returns built on real improvement usually stay. Returns built on conditions don’t.
Second, look at time. One good year means nothing. Better businesses show decent ROE across several years, including weaker phases. If ROE drops sharply the moment things slow, that’s a warning.
Third, check the balance sheet. High ROE with rising debt is fragile. Borrowings, interest costs, and dilution tell you whether returns are being earned or forced.
Last, follow the cash. Profits should show up as cash over time. If they don’t, the ROE isn’t as strong as it looks.
This isn’t about finding exciting stocks. It’s about avoiding bad ones.
Comment “ROE” if you want more breakdowns like this.
Explore our Products
Research Framework

Emerging Titans
Combination of quantitative analysis, industry tailwinds, and management assessment - SPRINT investment philosophy

Tiny Titans
Heavy emphasis on scuttlebutt research, plant visits, and early on-ground signals
FAQs
Which penny stock gave the highest return?
+What percentage of penny stocks succeed?
Only a very small fraction ever turn into serious wealth creators. Most remain stagnant, dilute shareholders, or disappear entirely. Investors remember the winners and forget the hundreds that failed — a classic case of survivorship bias.
Which stock can give 1000% returns?
The question itself is misplaced. You cannot identify a 1000% return stock beforehand. What you can identify are businesses that are capable of such outcomes — small companies where ROE is improving, cash flows are strengthening, and earnings volatility is reducing.
What is the most successful penny stock ever?
+The most successful stories were not treated as penny stocks by investors who understood the business early. By the time the stock became widely known as a “big winner,” it had already stopped behaving like a penny stock.

High growth stock specialist, Value Educator
Shashank Mahajan is an equity research professional with over 12 years of experience in identifying high-potential SME and micro-cap stocks at an early stage. He follows a rigorous scuttlebutt research–driven approach, combining on-ground insights with deep financial analysis. Shashank specializes in uncovering under-researched and under-owned companies with strong management quality and long-term growth potential. Through disciplined research and early identification, he focuses on spotting tomorrow’s market leaders before they enter the mainstream investor radar.

Glenmark: The USD 700 Mn Cancer Deal and Its Brands

Pharma Stocks in India 2026: Generics, APIs and CDMOs

Granules India: From Paracetamol to a 65% Gross Margin

Natco Pharma: After Revlimid, 29 Patent Challenges

Shilpa Medicare: Cancer APIs, Films and Biosimilars

Alembic Pharma: US Plants Pay Back, Margin Hits 22.2%
Explore our Products
Research Framework
Emerging Titans
Combination of quantitative analysis, industry tailwinds, and management assessment - SPRINT investment philosophy
Tiny Titans
Heavy emphasis on scuttlebutt research, plant visits, and early on-ground signals



Modern Warfare to Multibaggers
Key Trends. Strategic Shifts. Opportunities Ahead.
Today at 7:00 PM IST. Room opens 30 minutes before.
Don't Miss This Exclusive Webinar!
Join Value Educator to decode the key trends shaping India's defence sector and learn how to identify tomorrow's potential leaders in the space.
- In-depth research on India's defence sector
- Live Q&A session
- Actionable takeaways for long-term investors

 Orders
 Subscription
 Share with friends


Required Details
₹23999.00
(12 month subscription)
As per SEBI regulations, all users are mandated to complete the KYC that is validated for 1 year. Post payment, you will be redirected to the KYC screen


No comments yet. Be the first to comment!