
HFCL vs Sterlite Technologies: Optical Fibre Compared

In July-September 2026, two Indian optical fibre makers reported almost the same revenue. HFCL booked ₹2,541.79 Cr, up 143.62% from a year earlier, and Sterlite Technologies (STL) booked ₹2,529 Cr, up 145%. Both now sell a large share of their cable abroad, both have signed multi-year supply deals worth more than a billion dollars with global customers, and both are spending to add fibre and cable capacity for AI data centres.
That is why investors search for "HFCL vs STL". The two are not the same business, though. They differ in how far back into the glass each one goes, in how much of their revenue comes from cable, in how their order books are built and in their balance sheets. This page sets the two side by side on their own filed figures for FY26 and the July-September 2026 quarter (Q2 FY27). STL figures cover its continuing business: it demerged its global services business into a separate company, STL Networks Limited, effective 31 March 2025. HFCL figures are consolidated. For the wider list of companies supplying data centres, see our page on data centre stocks in India.
Figures as of 20 November 2026. This page is research, not a recommendation to buy or sell any stock.
HFCL vs Sterlite Technologies at a Glance
| Measure | HFCL | Sterlite Technologies (STL) |
|---|---|---|
| Business | Optical fibre and cable, data-centre connectivity, telecom equipment, defence products and turnkey network contracts | Preform, optical fibre and cable, and optical connectivity; a small digital services arm |
| Plants and capacity | Six plants in India, including Hyderabad, Goa, Chennai and Hosur; 28 million fkm of fibre and 39 million fkm of cable a year | 10-plus plants, including one in South Carolina, US; capacity not disclosed, about 70% used (September 2026) |
| FY26 revenue | ₹4,949.27 Cr | ₹4,745 Cr |
| FY26 EBITDA margin | 16.70% | 13.2% |
| FY26 PAT | ₹329.44 Cr | ₹56 Cr |
| FY26 ROCE (as each reports it) | 11.04% | 9.4% |
| FY26 ROE (PAT on closing equity) | 6.7% | 2.5% |
| Net debt (September 2026) | Net debt of ₹1,245.37 Cr | Net cash of ₹703 Cr (includes about ₹396 Cr of restricted cash) |
| Order book | ₹28,911 Cr (September 2026) | ₹35,274 Cr (September 2026) |
| Q2 FY27 revenue growth | 143.62% | 145% |
| Customers | 80+ customers in 60+ countries; 92% of revenue from private customers | Data centres 33% of H1 FY27 revenue; North America 61% |
| Key risk | Preform supply and prices, turnkey losses, working capital | Two large hyperscaler contracts, a US court case of USD 101.25 million |
Business Models: Where Each One Sits
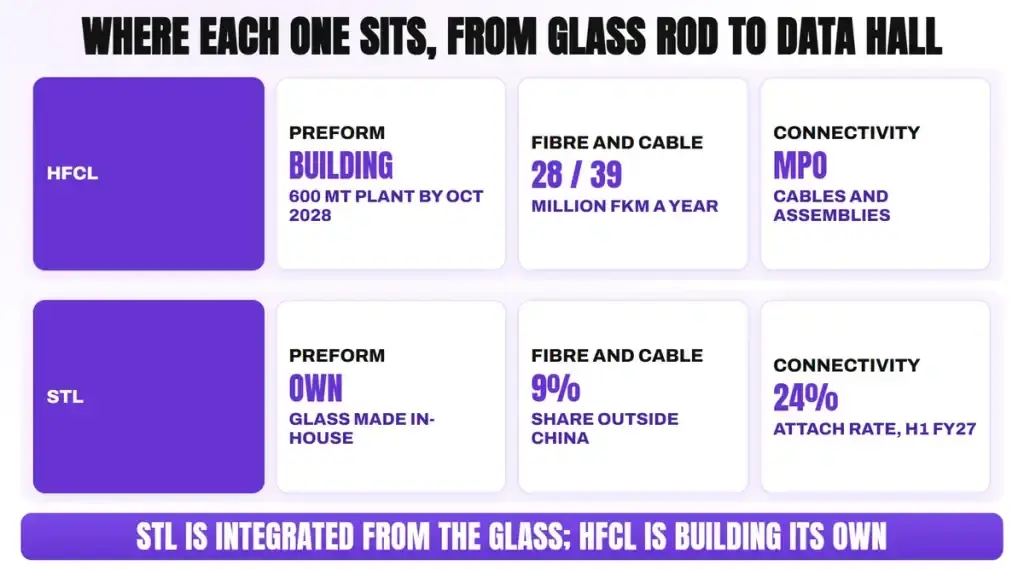
An optical fibre cable starts as a preform, a thick rod of very pure glass. The rod is heated and drawn into fibre thinner than a hair, the fibre is bundled into cable, and the cable is finished with connectors and assemblies that plug into telecom networks and data halls. Preform makes up about 45% of the cost of a cable, so who makes it matters for margins.
HFCL: a cable maker with telecom, defence and turnkey arms
HFCL, based in Gurugram and incorporated in 1987, draws its own fibre and makes cable, at a capacity of 28 million fibre kilometres (fkm) of fibre and 39 million fkm of cable a year. It buys preform from outside suppliers, partly under long-term contracts, and is building a 600 MT preform plant due by October 2028. Management says the plant will cover about half of its need, and that making preform costs about 30% less than buying it.
Cable is now most of the business. In Q2 FY27, telecom products, which include the cable, brought in ₹2,321.98 Cr of revenue, turnkey contracts ₹136.07 Cr and defence ₹54.94 Cr. Products were about 91% of revenue. HFCL started a data-centre connectivity business in FY27 (MPO cables and cable assemblies), which management put at about ₹300 Cr in Q2 FY27. Exports were about 63% of revenue, against 41.36% in FY26, and hyperscalers make up about 70% of the export orders. HFCL also makes Wi-Fi and 5G equipment and defence products such as thermal sights, artillery fuzes and radars.
STL: integrated from the glass to connectivity
STL, registered in Pune, has been in the business for 35-plus years. It makes its own glass preforms, draws the fibre, makes the cable and sells connectivity products, including a range for AI data centres. It has more than 805 patents filed and granted and 10-plus plants, including one in South Carolina in the US. Its share of the world fibre cable market outside China rose to 9% in H1 FY27, from 7% a year earlier.
STL reports two segments. In Q2 FY27, optical networking brought in ₹2,461 Cr and digital and technology solutions ₹86 Cr. The company tracks an "attach rate", its connectivity revenue as a share of its fibre cable revenue, which rose to 24% in H1 FY27 from 20%. Data centres were 33% of H1 FY27 revenue, and management aims to take that to 50% in FY27. By region, North America was 61% of H1 FY27 revenue, Europe 21% and the rest of the world 18%.
What the STL demerger means for this comparison
Until March 2025, STL also ran a global services business that built and maintained networks. That business was demerged into STL Networks Limited effective 31 March 2025, and STL's shareholders received shares in it. STL's figures for FY24 onward have been restated without it, and those are the figures used here. Its FY22 and FY23 figures, as reported at the time, still include that business, so they are shown separately below and are not compared directly with HFCL.
Latest Quarter: Q2 FY27 Side by Side
HFCL reported on 19 October 2026 and STL on 23 October 2026. Both called it the best quarter in their history.
| Q2 FY27 (July-September 2026), ₹ Cr | HFCL | STL |
|---|---|---|
| Revenue | 2,541.79 | 2,529 |
| Revenue in Q2 FY26 | 1,043.34 | 1,034 |
| Growth from a year earlier | 143.62% | 145% |
| EBITDA as reported | 658.00 | 846 |
| EBITDA margin as reported | 25.89% | 33.5% |
| EBITDA without other income and one-offs | 630.54 (24.8%) | 651 (25.7%) |
| Finance cost | 65.34 | 63 |
| PAT | 394.22 | 517 |
| PAT margin | 15.51% | 20.4% |
| H1 FY27 revenue | 4,456.77 | 4,439 |
| H1 FY27 PAT | 639.86 | 714 |
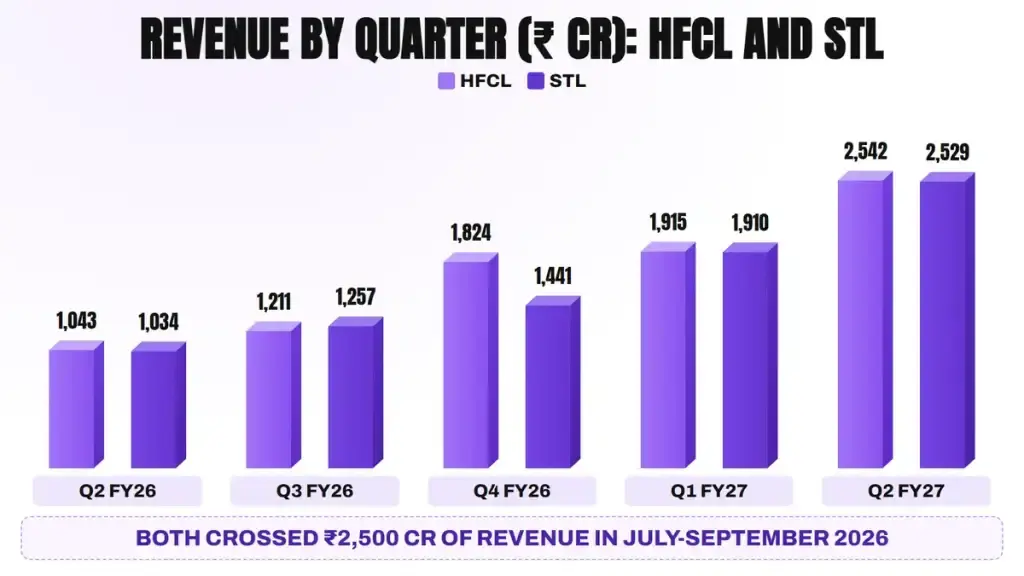
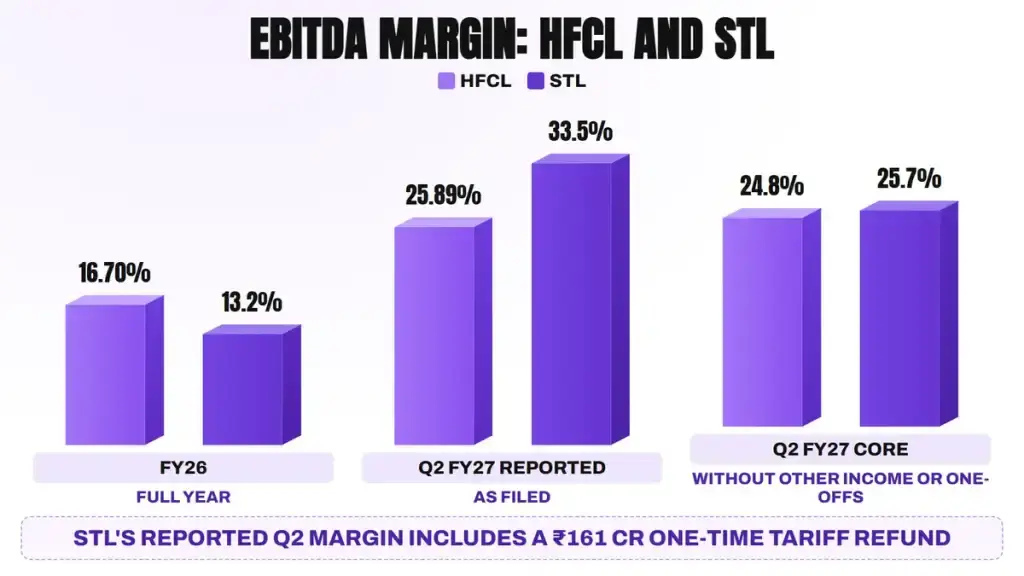
The reported margins are not like for like. STL's EBITDA of ₹846 Cr includes a one-time net gain of ₹161 Cr from a US tariff refund, and both companies' EBITDA includes other income (₹27.46 Cr at HFCL, ₹34 Cr at STL). Taking those out, the two earned a core EBITDA margin of 24.8% (HFCL) and 25.7% (STL), within a percentage point of each other. STL's own figure for its operating margin, without the refund, was 27.1%. STL's PAT of ₹517 Cr also carries the refund, against ₹4 Cr a year earlier.
What drove each quarter differs. At HFCL, telecom products revenue rose from ₹490.10 Cr to ₹2,321.98 Cr, while turnkey contract revenue fell from ₹506.77 Cr to ₹136.07 Cr and that segment lost ₹122.58 Cr. Management said growth came from both volume and price, with fibre prices up about 20% in the quarter, and exports grew about 493%. At STL, management pointed to higher use of its plants, a richer mix of products and customers, and a larger share of connectivity products. It also said that spot orders, once a meaningful part of each quarter, are now a negligible share; most revenue now comes from scheduled deliveries against long-term contracts.
Five-Year Financials: FY22 to FY26
HFCL (consolidated, ₹ Cr)
| Year | Revenue | EBITDA | EBITDA margin | PAT |
|---|---|---|---|---|
| FY22 | 4,727.11 | 692.98 | 14.66% | 325.86 |
| FY23 | 4,743.31 | 665.86 | 14.04% | 317.71 |
| FY24 | 4,465.05 | 682.13 | 15.28% | 337.52 |
| FY25 | 4,064.52 | 506.75 | 12.47% | 173.26 |
| FY26 | 4,949.27 | 826.75 | 16.70% | 329.44 |
Sterlite Technologies (consolidated, ₹ Cr)
| Year | Entity covered | Revenue | EBITDA | EBITDA margin | PAT |
|---|---|---|---|---|---|
| FY22 | As reported then, includes the services business later demerged | 5,437 | 723 | 13.3% | 162 |
| FY23 | As reported then, includes the services business later demerged | 6,925 | 931 | 13.4% | 245 |
| FY24 | Restated, without the services business | 4,083 | 527 | 12.9% | Loss of 71 |
| FY25 | Without the services business | 3,996 | 452 | 11.3% | Loss of 72 |
| FY26 | Without the services business | 4,745 | 628 | 13.2% | 56 |
HFCL's revenue stayed between ₹4,064.52 Cr (FY25) and ₹4,949.27 Cr (FY26) in these five years and it made a profit every year, with a dip in FY25 when global fibre demand slowed. FY26 revenue grew 21.8%.
On a like-for-like basis, without the services business, STL's revenue moved in a similar band, from ₹4,083 Cr in FY24 to ₹4,745 Cr in FY26, up 18.7% in the last year. It made losses in FY24 and FY25 on that basis and returned to a small profit of ₹56 Cr in FY26. The FY22 and FY23 figures are larger only because they still include the services business; they are not a fall in the cable business. The jump in both companies' numbers came after FY26, in the first half of FY27, when STL's revenue grew 116.1% and HFCL's 132.81%.
Order Book and Growth Plans
| Order book, ₹ Cr | HFCL | STL |
|---|---|---|
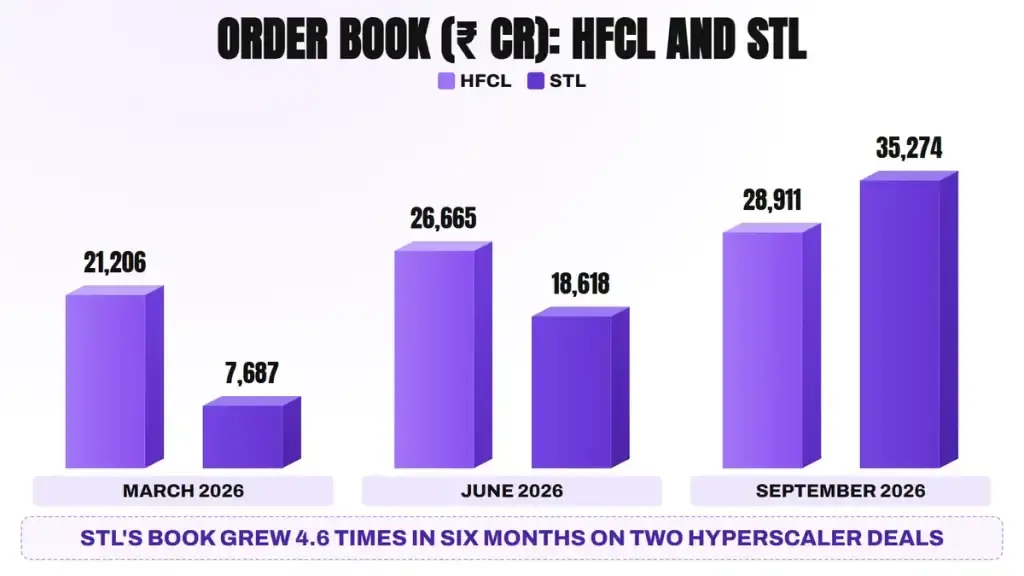
| March 2026 | 21,206 | 7,687 |
| June 2026 | 26,665 | 18,618 |
| September 2026 | 28,911 | 35,274 |
| September 2026 book as a multiple of FY26 revenue | 5.8 times | 7.4 times |
How each order book was built
STL's order book grew 4.6 times in six months. It won orders worth ₹32,000 Cr in H1 FY27, about 4 times its order intake in the whole of FY26. Two contracts with global hyperscalers did most of the work: a USD 1.11 billion award for optical connectivity in the June quarter, and a five-year supply agreement with a potential value of about USD 1.2 billion, filed on 1 October 2026. About ₹3,021 Cr of the book is due for delivery in Q3 FY27, and the rest from Q4 FY27 onward.
HFCL's book grew 1.4 times in the same six months, from a larger base. Its largest single contract is a five-year supply agreement worth about USD 1.10 billion (₹10,159 Cr) signed with a global multinational in March 2026, for calendar years 2026 to 2028, extendable to 2029 and 2030. A second long-term agreement worth ₹2,329 Cr covers 2027 to 2029. HFCL's book is more mixed than STL's: in September 2026, products made up ₹19,751 Cr, operations and maintenance ₹5,070 Cr and network contracts ₹4,090 Cr, and government customers accounted for ₹10,105 Cr of it.
Capacity and targets
HFCL plans capex of about ₹1,800 Cr to take fibre capacity to 43.10 million fkm and cable capacity to 62.00 million fkm by July 2028, and to build the 600 MT preform plant by October 2028. Management expects revenue growth of at least 80% in FY27 and has spoken of ₹10,000 Cr of revenue by FY29, about 2.0 times FY26, with an EBITDA margin above 27%.
STL plans to add about 50% to its preform, fibre and cable capacity by the end of FY29, at a cost of about ₹3,000 Cr, or about ₹1,000 Cr a year from 2027 to 2029, plus a new plant for pre-terminated connectivity products. Under its plan called Lakshya, it aims for ₹20,000 Cr of revenue in FY29, about 4.2 times FY26, and in October 2026 raised its FY29 EBITDA margin aim to about 30%, from 27%. Both sets of numbers are management targets, not results.
Balance Sheet and Cash Flow
| ₹ Cr | HFCL | STL |
|---|---|---|
| Total equity, September 2026 | 5,755.44 | 4,543 |
| Borrowings, September 2026 | 1,840.13 | 864 |
| Net debt (or net cash), September 2026 | Net debt of 1,245.37 | Net cash of 703 |
| Net debt, March 2026 | 1,244.95 | 1,128 |
| Trade receivables (current), September 2026 | 2,630.03 | 1,606 |
| Operating cash flow, FY26 | Minus 378.13 | 520 |
| Operating cash flow, H1 FY27 | 455.27 | 692 |
| Capex, H1 FY27 | 436.27 | 257 |
| Free cash flow, H1 FY27 | 19.00 | 435 |
| Credit rating | CARE A; Positive (July 2026) | CRISIL AA/Stable (as of October 2026) |
Six months ago the two had almost the same net debt. STL then raised ₹1,500 Cr through a qualified institutions placement in H1 FY27 and used the money to repay borrowings and for general purposes. Its borrowings fell from ₹1,827 Cr in March 2026 to ₹864 Cr, and it now reports net cash of ₹703 Cr. That figure includes about ₹396 Cr of cash set aside for a legal case in the US. The share sale took the promoters' holding from 44.44% to 42.29%.
HFCL's net debt was about the same in September 2026 as in March 2026, while its equity grew by ₹806.85 Cr. Its debt-to-equity ratio was 0.35 in FY26, and management has said debt reduction will start this year.
The bigger gap is in cash generation. In FY26, HFCL used ₹378.13 Cr of cash in its operations, with more money tied up in receivables, while STL generated ₹520 Cr. In H1 FY27 both brought in cash from operations, but HFCL spent almost all of its ₹455.27 Cr on capex, leaving ₹19.00 Cr, while STL kept ₹435 Cr. Our guide to the cash flow statement explains why cash from operations can differ from profit, and our piece on the debt-to-equity ratio explains how to read borrowings against equity.
Risks for Each
HFCL
- Preform supply and prices. Until its own plant is ready in October 2028, HFCL buys its preform from outside suppliers. Management said market preform prices have gone up by 600%, to about USD 300 per kg, and some countries restrict exports of germanium, a raw material.
- Turnkey losses. The turnkey segment lost ₹122.58 Cr in Q2 FY27. Management expects losses of no more than ₹75 Cr to ₹100 Cr over the next two quarters and profit in this segment from Q1 FY28.
- Working capital. Operating cash flow was negative in FY26, and receivables stood at ₹2,889.58 Cr in September 2026.
- Price resets. Customer prices are reset year to year, so a fall in fibre prices would reach revenue within a year.
STL
- Concentration. Two hyperscaler contracts account for most of the rise in the order book, and North America is 61% of revenue.
- The Prysmian case. A US court confirmed an award of USD 101.25 million against STL's US subsidiary in a case brought by Prysmian. The subsidiary has appealed and deposited a bond of USD 41.53 million; the outcome is not known.
- A flattered quarter. Q2 FY27 profit includes the ₹161 Cr one-time tariff refund, which will not repeat.
- Execution. STL plans to add about 50% to capacity by FY29 for about ₹3,000 Cr, and it made losses as recently as FY24 and FY25.
For both, optical fibre is a cyclical product. Fibre and preform prices have risen sharply as data-centre demand grew, and makers around the world are adding capacity.
Which Is Stronger on Each Measure?
| Measure | Stronger | Why |
|---|---|---|
| Size of the latest quarter | About level | Q2 FY27 revenue of ₹2,541.79 Cr (HFCL) against ₹2,529 Cr (STL) |
| Core margin, Q2 FY27 | STL, narrowly | 25.7% against 24.8%, without other income and one-offs |
| Full-year margin and profit, FY26 | HFCL | EBITDA margin of 16.70% against 13.2%; PAT of ₹329.44 Cr against ₹56 Cr |
| Return on capital, FY26 | HFCL | ROCE of 11.04% against 9.4% |
| Profit record, FY22-FY26 | HFCL | Profit every year; STL made losses in FY24 and FY25 |
| Order book | STL | ₹35,274 Cr against ₹28,911 Cr; 7.4 times FY26 revenue against 5.8 times |
| Spread of the order book | HFCL | Products, maintenance and network contracts, and government as well as private customers |
| Balance sheet | STL | Net cash of ₹703 Cr against net debt of ₹1,245.37 Cr |
| Cash flow | STL | FY26 operating cash flow of ₹520 Cr against minus ₹378.13 Cr |
| Control of preform | STL | Makes its own today; HFCL buys from outside until its plant is ready by October 2028 |
| Business spread beyond cable | HFCL | Defence, telecom equipment and turnkey work alongside cable |
Explore our Products
Research Framework

Emerging Titans
Combination of quantitative analysis, industry tailwinds, and management assessment - SPRINT investment philosophy

Tiny Titans
Heavy emphasis on scuttlebutt research, plant visits, and early on-ground signals
Conclusion
On the latest quarter, HFCL and Sterlite Technologies are almost the same size and earn almost the same core margin. The differences sit underneath. STL is integrated from the glass, has a larger order book built on two hyperscaler contracts, generates more cash and now holds net cash after its share sale. HFCL has the better full-year profit record and return on capital, a more spread-out order book that includes Indian government work, and businesses beyond cable, but it still buys its preform from outside and has used cash to fund working capital and capex.
What each one needs to show is also different. HFCL's next quarters depend on finishing its turnkey losses, getting its preform plant running and turning profit into cash. STL's depend on delivering the two hyperscaler contracts on time, holding its margin without one-off gains, and the outcome of the US court case. Which profile fits an investor depends on whether they weigh integration, cash and order size more, or profit history, diversity and return on capital.
FAQs
HFCL vs Sterlite Technologies: which is better?
+Neither is better on every measure. In Q2 FY27 both had revenue of about ₹2,500 Cr and a core EBITDA margin of about 25%. STL is stronger on order book (₹35,274 Cr), cash flow and balance sheet (net cash of ₹703 Cr), while HFCL is stronger on FY26 profit (₹329.44 Cr), ROCE (11.04%) and its profit record from FY22 to FY26.
Which company has the bigger order book, HFCL or STL?
+STL, with ₹35,274 Cr in September 2026 against HFCL's ₹28,911 Cr. STL's book grew 4.6 times in six months on two hyperscaler contracts, while HFCL's book is spread across products, maintenance and network contracts, with ₹10,105 Cr from government customers.
Did Sterlite Technologies demerge a business?
+Yes. STL demerged its global services business into STL Networks Limited effective 31 March 2025. STL's figures from FY24 onward exclude that business, which is why its FY22 and FY23 revenue looks larger.
Which has the higher margin, HFCL or STL?
+In FY26, HFCL's EBITDA margin was 16.70% against STL's 13.2%. In Q2 FY27, STL reported 33.5% against HFCL's 25.89%, but STL's figure includes a one-time refund of ₹161 Cr. Without other income and one-offs, the margins were 25.7% for STL and 24.8% for HFCL.
Which company has more debt?
+HFCL had net debt of ₹1,245.37 Cr in September 2026. STL reported net cash of ₹703 Cr after raising ₹1,500 Cr from a share sale and repaying debt, though that cash includes about ₹396 Cr set aside for a US legal case.
Do HFCL and STL make their own preform?
+STL makes its own glass preforms and draws fibre from them. HFCL draws fibre and makes cable but buys its preform from outside suppliers; it is building a 600 MT preform plant due by October 2028.

High growth stock specialist, Value Educator
Shashank Mahajan is an equity research professional with over 12 years of experience in identifying high-potential SME and micro-cap stocks at an early stage. He follows a rigorous scuttlebutt research–driven approach, combining on-ground insights with deep financial analysis. Shashank specializes in uncovering under-researched and under-owned companies with strong management quality and long-term growth potential. Through disciplined research and early identification, he focuses on spotting tomorrow’s market leaders before they enter the mainstream investor radar.
More about Shashank Mahajan →
Azad Engineering vs MTAR vs Unimech: Aerospace Parts
Subros vs Lumax Auto vs Sona BLW: EV Auto Parts Compared
Jyoti CNC vs Macpower CNC: Machine Tool Makers Compared
Data Patterns vs Astra Microwave vs Apollo Micro

Himadri vs PCBL: Carbon Black and Battery Materials

Inox Wind vs Suzlon: Wind Turbine Makers Compared
Explore our Products
Research Framework
Emerging Titans
Combination of quantitative analysis, industry tailwinds, and management assessment - SPRINT investment philosophy
Tiny Titans
Heavy emphasis on scuttlebutt research, plant visits, and early on-ground signals



India's Aerospace Opportunity
Global Demand. Supply Bottlenecks. Opportunities Ahead.
Don't Miss This Exclusive Webinar!
Join Value Educator to decode the key trends shaping India's aerospace sector and learn how to identify tomorrow's potential leaders in the space.
- How the aircraft value chain works, layer by layer
- Indian companies supplying global aircraft makers
- A framework to judge any aerospace company

 Orders
 Subscription
 Share with friends


Required Details
₹23999.00
(12 month subscription)
As per SEBI regulations, all users are mandated to complete the KYC that is validated for 1 year. Post payment, you will be redirected to the KYC screen


No comments yet. Be the first to comment!