
Inox Wind: ₹449.1 Cr Profit, Minus ₹598.1 Cr Cash Flow
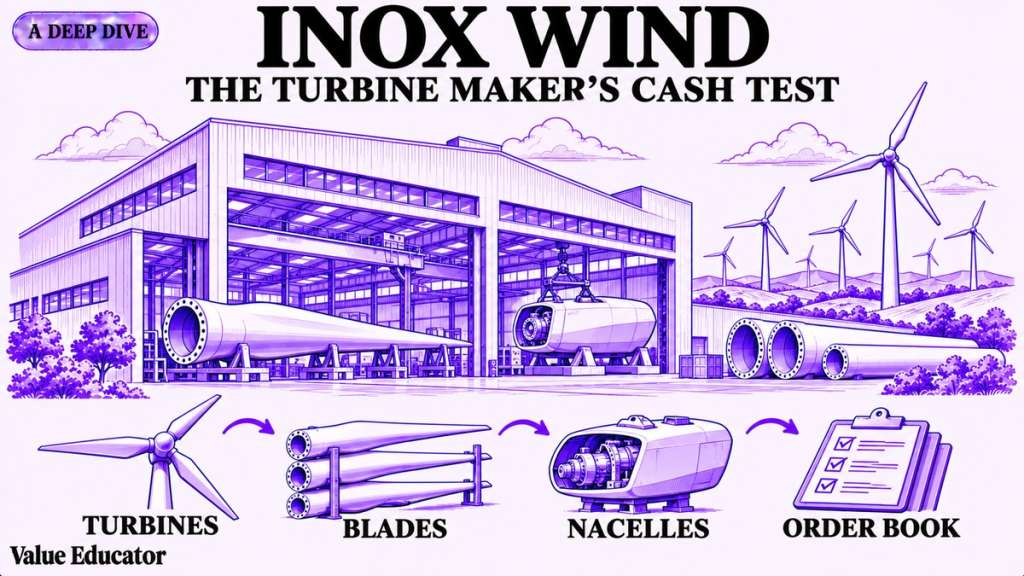
In FY23, an Indian wind turbine maker reported a loss of ₹712.4 Cr on revenue of ₹733.0 Cr. Three years later, in FY26, it earned a profit after tax of ₹449.1 Cr on revenue of ₹4,397.5 Cr. Its revenue grew about seven times from FY22 to FY26. Since early 2025 its order book has stayed above 3 gigawatts (GW), and in July 2026 it touched about 4.4 GW.
That turnaround has a second side, though. In FY26 the same company reported an operating cash flow of minus ₹598.1 Cr. The money its customers owed it, its trade receivables, stood at ₹4,249.8 Cr in March 2026. That was almost as much as its whole revenue for the year.
So who is this company? It makes wind turbines. A wind turbine generator, or WTG, is the machine that turns wind into electricity. It has three long blades, a tall steel tower and, on top of the tower, the nacelle. The nacelle is the housing that holds the generator and the controls. The company makes these parts in five plants in Gujarat, Madhya Pradesh and Himachal Pradesh, with about 2,500 megawatts (MW) of yearly capacity.
That company is Inox Wind Limited (NSE: INOXWIND), part of the INOXGFL group and based in Noida. It sells its turbines in two ways. A turnkey contract means it builds the whole wind farm: it finds the land, builds the roads and power lines, puts up the turbines and hands over a working project. An equipment supply contract means it only makes and delivers the turbines, and the customer builds the rest.

That difference matters a lot for cash. In a turnkey contract, much of the money comes only after the project is commissioned, and land, weather or a late grid line can hold that up for months. Receivable days is the number of days of sales that are still unpaid. It is the trade receivables divided by revenue, multiplied by 365. For Inox Wind it was about 353 days in March 2026.
Inox Wind in five numbers
- FY26 revenue of ₹4,397.5 Cr and profit after tax of ₹449.1 Cr
- FY26 operating cash flow of minus ₹598.1 Cr
- Trade receivables of ₹4,225.4 Cr in September 2026, about 334 days of sales
- An order book of about 3.8 GW in October 2026, with 61% of third-party orders now for equipment supply
- A target of about ₹7,500 Cr of revenue at about 20% EBITDA margin in FY28
So the profit is real, and the cash has not followed it yet. Management's answer is to move from turnkey work to equipment supply, and to win more orders from its own group. Let's first understand the company, and then look at the latest quarter.
Inox Wind: Company Overview
Inox Wind Limited was incorporated in 2009, has its registered office at Una in Himachal Pradesh and its corporate office in Noida, and is part of the INOXGFL group; the promoter group held 44% in September 2026. Devansh Jain of the group is a Whole-time Director, and Saibaba Vutukuri took over as Managing Director (Wind Business) of the INOXGFL group on 14 November 2026. The company makes 2 MW and 3 MW class wind turbines, with a 4.45 MW prototype up in Gujarat, in five plants at Barwani, Bhuj, Rohika, Kalyangadh and Una with about 2,500 MW of yearly capacity. Its subsidiary Inox Renewable Solutions builds wind and solar farms and power lines, and its listed subsidiary Inox Green Energy Services runs and maintains them. Revenue from operations was ₹4,397.5 Cr in FY26 and profit after tax was ₹449.1 Cr, while total borrowings stood at ₹2,473.7 Cr in September 2026. Read this Suzlon: How It Reclaimed India's Wind Market
"An investment in knowledge pays the best interest."
— Benjamin Franklin
Inox Wind's results mix turbine sales, building work and maintenance across several group companies. Knowing which part earns the profit and which part ties up the cash is the first step to reading them.
A September Quarter With More Revenue and a Thinner Margin
Let's start with Q2 FY27, the July to September quarter of 2026, which the company reported on 13 November 2026. Revenue from operations was ₹1,354.3 Cr, up 21.0% from ₹1,119.2 Cr a year ago. It was also 66.4% higher than the ₹814.1 Cr of Q1 FY27.

As the table shows, revenue went up but profit did not follow. EBITDA, which is earnings before interest, tax, depreciation and amortisation, was ₹228.6 Cr against ₹271.0 Cr a year ago. Profit after tax was ₹68.6 Cr, against ₹120.6 Cr. The company's own adjusted EBITDA, which leaves out provisions for doubtful dues and one-time charges, was ₹238 Cr, at a margin of about 17%. Its cash profit, which adds back depreciation and deferred tax to profit after tax, was ₹165 Cr.
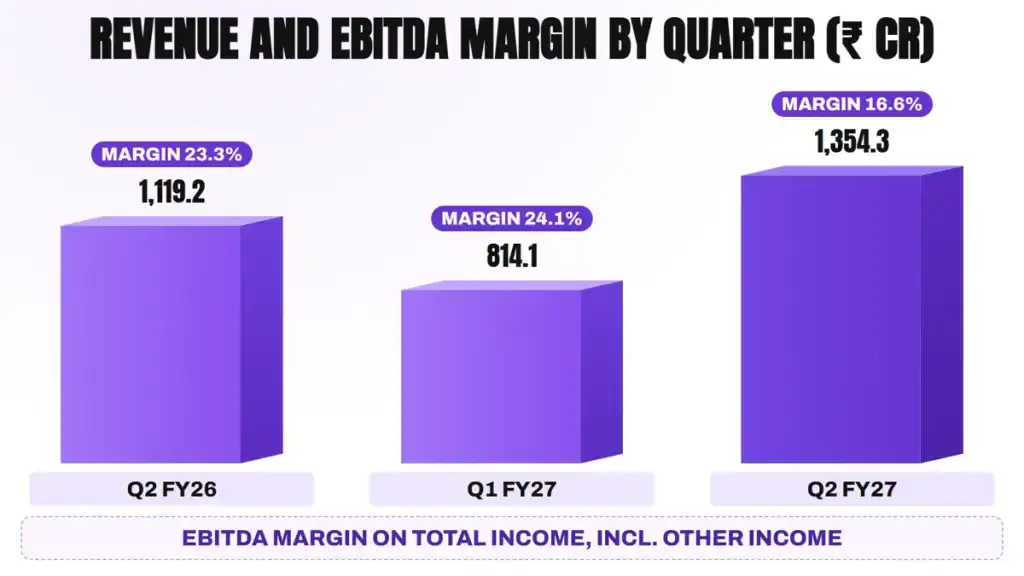
That margin change came mostly from materials. In Q2 FY27, the cost of materials, net of the change in stock, came to about 61.7% of revenue. A year ago it was about 55.7%, and in Q1 FY27 about 47.3%. So the share of revenue left after materials, the gross margin, went from about 44.3% to about 38.3% in a year.
Those costs, management says, rose with commodity and raw-material prices during the West Asia war. It says new contracts and fresh bids are being priced to reflect current costs, so the margin should recover as those newer orders reach execution.
There is one more reason given for the lower margin. In the same deck, management says income from the Wind World O&M portfolio, bought through its subsidiary Inox Green, was not yet in the profit and loss account for the quarter. Had it been counted, it says, the consolidated EBITDA margin would have been about 20%. That business will be consolidated from Q3 FY27.
That same pattern shows in the first half, at a larger scale. H1 FY27 revenue was ₹2,168.4 Cr, up 11.5% from ₹1,945.4 Cr. Profit after tax for the half was ₹141.4 Cr, against ₹218.0 Cr a year ago. Finance cost for the half was ₹120.1 Cr, against ₹84.6 Cr.
Cash in the half tells its own part. Operating cash flow for H1 FY27 was minus ₹462.3 Cr, against minus ₹420.5 Cr in H1 FY26. Trade receivables were about flat at ₹4,225.4 Cr in September, against ₹4,249.8 Cr in March. But inventory rose by ₹328.1 Cr to ₹2,118.3 Cr, and other current liabilities, which include advances from customers, went down from ₹816.5 Cr to ₹418.3 Cr. Total borrowings rose to ₹2,473.7 Cr, from ₹1,551.5 Cr in March.
On the same day, the board made a leadership change. Sanjeev Agarwal resigned as Chief Executive Officer for personal reasons from 13 November 2026, and will stay on as an advisor until 31 December. Saibaba Vutukuri was appointed Managing Director (Wind Business) of the INOXGFL group from 14 November.
The Order Book After the July Peak
Now let's look at the orders, because they show how much work is already booked. In July 2026 the company put its order book at about 4.4 GW. That figure included a memorandum of understanding (MOU) for 1.5 GW with group company Inox Clean Energy, of which 500 MW had been signed as firm orders, plus a 200 MW order from NLC India.
In the November deck, the order book was about 3.8 GW as of October 2026. The company added orders of 350 MW from public sector companies and power producers in Q2 FY27. Its customers include NTPC, CESC, NLC India, Aditya Birla, Amplus/Gentari, Hero Future Energies and Inox Clean. Management says the book gives revenue visibility of more than 24 months.

That book is also changing shape. In October 2026, 61% of third-party orders by scope were for equipment supply and 39% were turnkey. In Q1 FY24 almost all of the company's projects were turnkey. Management's aim is about 75% equipment supply.
What the order book says: about 3.8 GW is more than 2.5 times the 1.5 GW a year of execution that management used as a rough guide in August 2026. The shift to equipment supply is the change that matters most for cash.
How Inox Wind Turned Profitable After FY24
Now that we have seen the quarter, let's go back to how the company got here. Inox Wind was incorporated in 2009 and is part of the INOXGFL group, whose companies include Gujarat Fluorochemicals. It has more than 13 years of operating record in making turbines. From FY22 to FY24 it reported a loss every year, as the table below shows.

As you can see, that table shows two very different halves. In FY22 and FY23, revenue was too small to cover the fixed costs of the plants, so the company spent more than it earned even before interest. Then revenue grew 138.2% in FY24 and 103.7% in FY25 as wind orders came back across India. The operating EBITDA margin moved to 15.0% in FY24 and 21.3% in FY25.
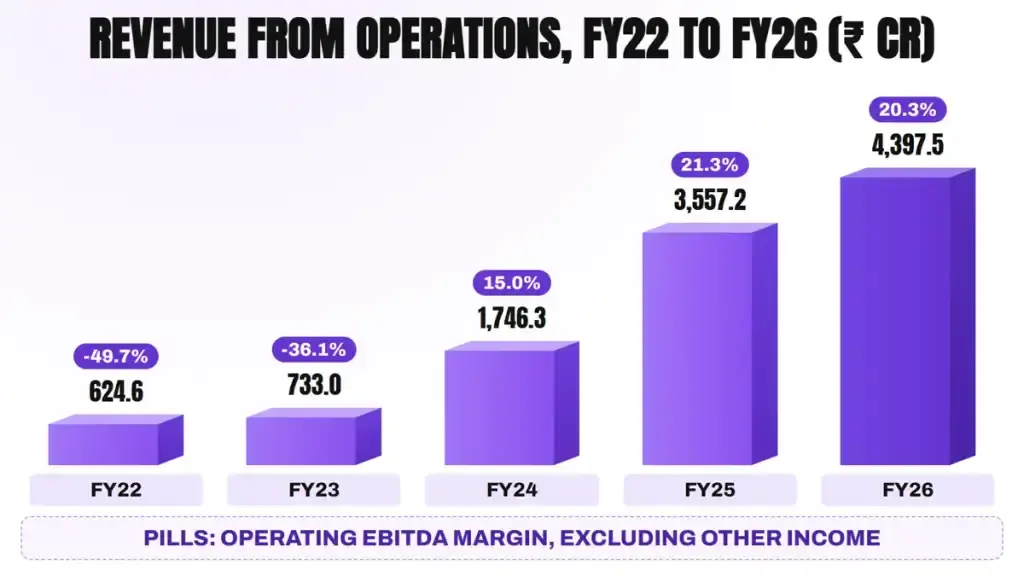
In FY26, growth was slower at 23.6%, and the margin was 20.3% on our measure. The company's own EBITDA figure, which includes other income and leaves out provisions for doubtful dues, was ₹1,232 Cr in FY26, at about 27% of total income. Both measures are useful, but the gap between them is worth knowing. Read this EBITDA Explained: Uses and Limits In FY26 the company set aside ₹136.3 Cr as an expected credit loss allowance, which is money it expects some customers may never pay.
Beyond the margin, profit after tax was ₹449.1 Cr in FY26, close to the ₹437.6 Cr of FY25. A large part of the tax line was deferred tax, set against tax credits from the loss years before FY25. So the cash tax paid stayed small.
"Look, the disruptions on the EPC still remain the same. They have been there for years." - Sanjeev Agarwal, then Chief Executive Officer, August 2026
The Cash Question Behind the Profit
That profit leads us to the main question for Inox Wind: why has it not turned into cash? Let's put profit and operating cash flow side by side for five years. Read this Cash Flow Statement Explained

So in FY25 and FY26 together, the company reported ₹886.7 Cr of profit after tax, while operating cash flow added up to minus ₹460.2 Cr. Over the five years from FY22 to FY26, operating cash flow came to about minus ₹2,401.3 Cr.

Most of that gap comes from receivables. Trade receivables went from ₹1,137.3 Cr in March 2024 to ₹4,249.8 Cr in March 2026, an increase of about ₹3,112.6 Cr. Revenue grew by about ₹2,651.2 Cr over the same two years. So the money owed to the company grew faster than its sales. Read this Days Sales Outstanding (DSO) Explained
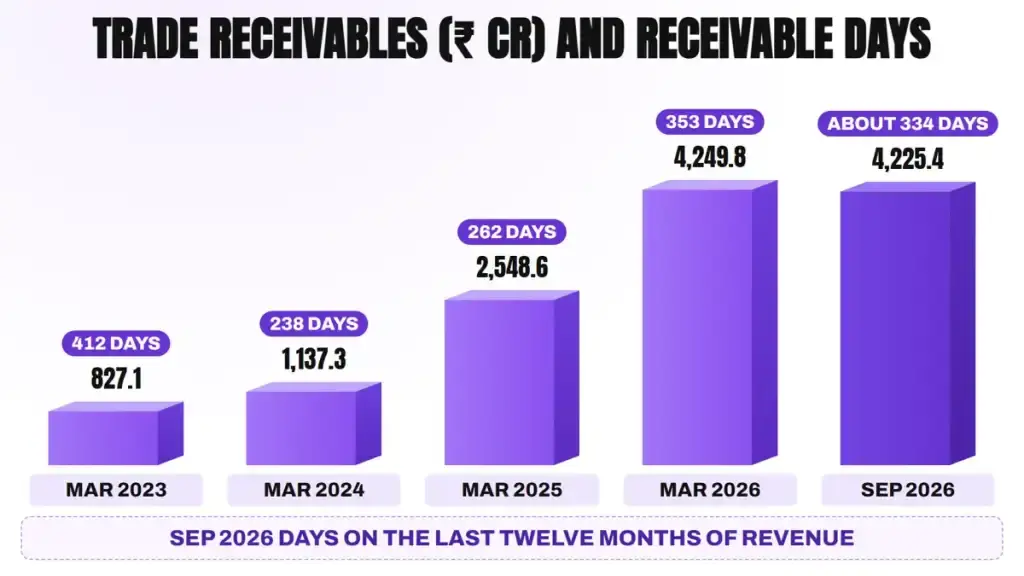
The reasons come from the way the company books revenue. Management explains that, under the accounting rules, it records revenue when the equipment is transferred to the customer. In a turnkey contract, part of the payment is due only when the turbine is commissioned. If a site is not ready, or the grid line is late, that money stays as a receivable.
"Only when the tide goes out do you discover who's been swimming naked."
— Warren Buffett
For a company that sells on long credit, the tide is the cash cycle. Profit can look healthy for years while receivables build up, and only collections show how much of it turns into money in the bank. In May 2026, management also said some public sector contracts had seen payment delays.
That is also why the company changed its plan. Management says that two years before May 2026, all of its order book was turnkey, and that turnkey work caused the biggest blockage of working capital. So it set a target of about 75% equipment supply. In an equipment supply contract, the customer inspects the turbine at the plant and takes delivery, so the sale and the payment come sooner.
So far, the latest half year gives us a first reading. Receivables stopped growing in H1 FY27, and on the last twelve months of revenue they come to about 334 days, against about 353 days in March 2026. The November deck speaks of a reduction in debtor days. But the cash still went out through other lines: inventory went up, customer advances came down, and payables to suppliers were lower.
Two more lines help to read the balance sheet. Payables to financiers under TReDS, a platform where suppliers get paid early by banks against the company's bills, were ₹410.1 Cr in March 2026, against ₹26.2 Cr a year earlier, and ₹381.9 Cr in September 2026. And the company's net debt figure counts only term loans: ₹608 Cr of term loans less ₹185 Cr of free cash gives ₹423 Cr. Total borrowings, including short-term loans for working capital, were ₹2,473.7 Cr.
What Management Expects From the Shift
So what does management expect from here? In February 2026, it said working capital would be about 200 days by March 2026, and hopefully about 150 days in FY27. In August 2026, it said receivables would come down a lot from Q2 and Q3 onwards, and that over the next three to four quarters the balance sheet would improve sharply.
That plan has three parts. One is the order mix, which has moved from almost all turnkey to mostly equipment supply in about two years. Another is the customer mix: in May 2026, the group's renewables CEO said two-thirds of yearly execution over the next four to five years would come from Inox Clean and CESC. The last is timing, since equipment can be sent to whichever customer has a ready site.
Those parts can work only if the customers pay on time, so the next two quarters matter. In May 2026, management also said about ₹400 Cr of FY26 revenue had moved into FY27, after an imported part was held up at sea. That revenue, once billed, should show up as cash later in the year if it is collected on time.
To fund this, the company has raised equity more than once. In FY26 it received about ₹1,619.1 Cr through share issues, and net worth rose to ₹7,692 Cr in March 2026 and ₹8,146.7 Cr in September 2026.
Four Businesses Under One Roof
Now let's split the business, because Inox Wind's consolidated numbers hold more than turbine sales. The company reports one business segment, wind turbines and related services. But its subsidiaries do different kinds of work.

As we can see, these lines feed each other. When Inox Wind sells a turbine, the subsidiary Inox Renewable Solutions can build the farm and Inox Green can maintain it for years after. That is why management calls it a fully integrated wind business.

Turbines From Five Plants
Let's start with the turbines, which bring in most of the revenue. Inox Wind makes and runs 2 MW and 3 MW class turbine platforms in several versions. It makes blades, towers, nacelles and hubs across its five plants at Barwani, Bhuj, Rohika, Kalyangadh and Una. The Kalyangadh unit for nacelles and hubs started work in FY26. The company is also working on a new blade and tower plant in South India, so that turbines for southern projects travel a shorter distance. Blades and towers are long and heavy, and moving them by road across states adds cost and time to every project.
Its next machine is a 4.45 MW turbine, the 4X series. The first prototype is up in Gujarat, and the November deck says the company is on track to launch the 4X turbines commercially. A larger turbine produces more power from each site, which matters as the best windy land fills up.
The company also says 80% to 90% of the parts in its turbines are made in India. In August 2026, management said it hoped to be almost 100% Indian-made before the end of the calendar year, for both its 3X and 4X models.
EPC and Power Lines
Next, let's look at the building work and the power lines. EPC means engineering, procurement and construction. Inox Renewable Solutions, earlier called Resco Global, does this work for the group. It has executed about 3.4 GW of projects across India and had about 29 ongoing projects in November 2026.
This business also owns substations and land at several sites in Gujarat, Rajasthan, Madhya Pradesh, Karnataka, Maharashtra and Tamil Nadu. It makes transformers in Jaipur and has started making 4.9 MVA transformers for the 4X turbine. It plans to make inverters and unit substations too. It also owns and operates four cranes of its own, the very large cranes that lift a nacelle to the top of a tower. Owning them means a project does not wait for a rented crane to become free, and the rental margin stays inside the group. Inox Wind's holding in it was 79.23% in September 2026, and the company expects it to list on the stock exchanges once approvals come.
O&M Through Inox Green
Next comes the service business. Inox Green Energy Services is a listed subsidiary that runs and maintains wind and solar farms. Its portfolio was about 12.5 GWp in September 2026, including about 10.4 GW of wind. Machine availability averaged 96.2% in Q2 FY27.
The big change here is an acquisition. Inox Green, through its subsidiary Vibhav Energy, has paid for the 4.5 GW wind O&M business of Wind World India, earlier Enercon India. That business had O&M revenue of about ₹580 Cr in FY26, and it will be consolidated from Q3 FY27. Statements on this business come from Inox Green's own management, and Inox Wind's numbers will include it as a subsidiary.
Orders From the Group
Finally, let's look at the group itself as a customer. Inox Clean Energy, a sister company, builds renewable power plants and makes solar cells and modules. Management says Inox Clean plans to add more than 3 GW of capacity a year, of which 20% to 30% is expected to be wind.
That is where the 1.5 GW MOU came from. Management said in August 2026 that contracts with Inox Clean are at arm's length, with the same inspection and payment terms as any other customer.
Where Inox Wind Sits in the Wind Value Chain
Now let's place the company in India's wind sector. A wind project starts with a developer, who wins a power contract and finds a windy site. Then come the turbines, the civil and electrical work, the grid connection, and decades of maintenance. Inox Wind and its subsidiaries cover the turbine, the building work and the maintenance.
As you can see from the numbers, that market has grown again in the last three years. India added about 6,057 MW of wind capacity in FY26, its highest ever, against about 3,253 MW in FY24. In H1 FY27 another 3.2 GW was added, and India's installed wind capacity reached about 59.2 GW in September 2026. The November deck cites an MNRE report that expects 7.5 to 8 GW of new wind capacity in FY27.
Demand is also changing shape. More tenders now ask for firm power, through hybrid, round-the-clock (RTC) and firm and dispatchable renewable energy (FDRE) projects. These mix solar, wind and batteries. The company says wind is usually 20% to 30% of such projects, because its output pattern complements solar.
That demand reaches Inox Wind through four kinds of buyers. Public sector companies such as NTPC and NLC India buy through tenders. Independent power producers win auctions and then order turbines. Commercial and industrial buyers want wind power for their own plants, and retail customers buy too. The company says its order book is spread across all four.
The fifth buyer is the group itself. Inox Clean targets 14 GW of hybrid renewable capacity by FY29, which means wind, solar and batteries together. If 20% to 30% of what it builds each year is wind, a steady stream of turbine orders can come from inside the group.
Inox Wind is one of a small group of Indian turbine makers. What sets Inox Wind apart is the group around it: a group customer that builds power plants, an EPC arm that owns land and substations, and a listed O&M company.
Why Inox Wind's Moat Is Hard to Copy
Now that we have seen the parts, let's understand the moat. A wind turbine maker needs a type-certified design, plants that can make blades and steel towers, and a record of turbines that work for 25 years. A new entrant cannot build all of that in one or two years.
One layer of the moat is manufacturing in India. Inox Wind makes blades, towers, nacelles and hubs in its own plants, and says 80% to 90% of its turbine parts are Indian-made. Rules that favour local manufacturing help a maker that has already spent on this.
Another layer is land and grid access. The group owns substations and has built common infrastructure at several windy sites. A customer who buys turbines from Inox Wind can connect to these power lines without waiting for a new one. The company calls this plug-and-play infrastructure, and it is not easy to copy, because the land and the grid approvals take years.
A third layer is the service tail. Every turbine sold can become an O&M contract for Inox Green, lasting 5 to 20 years. Over time, the installed base keeps paying even when new orders are slow.
"In business, I look for economic castles protected by unbreachable moats."
— Warren Buffett
Inox Wind's castle is its plants, its land and grid access, and the O&M contracts that follow each turbine. The question is whether that moat still holds once the company sells more equipment and builds fewer farms itself.
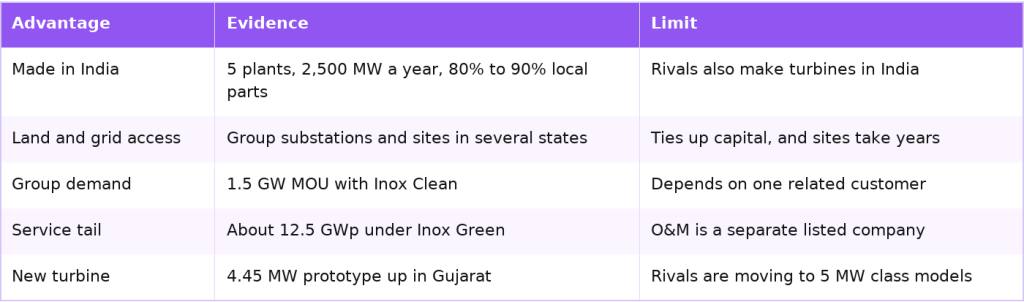

That table also shows the limit of the moat. Its strongest parts, the land, the power lines and the turnkey service, are the same parts that tie up cash. So the test of the moat is whether the company can keep winning orders as an equipment supplier, without the turnkey work that once set it apart.
Financials: Five Years of Revenue, Profit and Cash Flow
One year can mislead in a business where projects move between quarters and years, so let's look at five years together. Operating EBITDA here is our own measure: revenue less operating costs, before finance cost and depreciation and without other income. The first half of FY27 is shown for comparison.
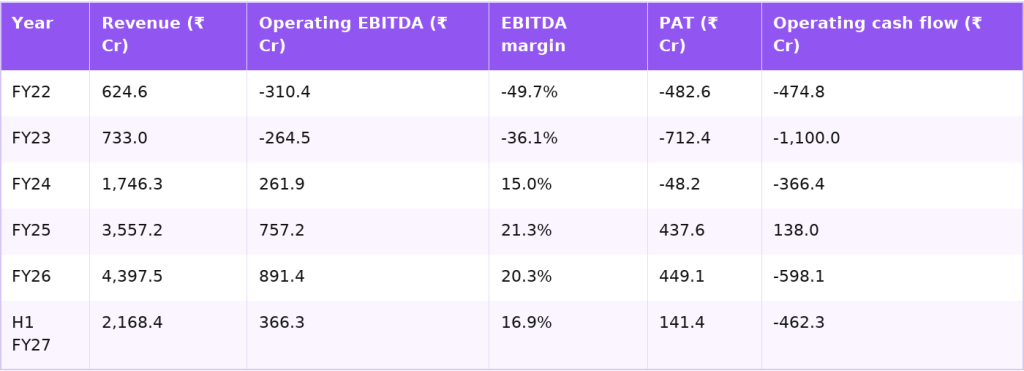
Revenue grew about seven times in four years, from ₹624.6 Cr in FY22 to ₹4,397.5 Cr in FY26, and the operating EBITDA margin moved from -49.7% to 20.3%. Profit after tax turned positive in FY25 and stayed there in FY26, at ₹449.1 Cr.
Cash flow has not followed profit. From FY22 to FY26, profit after tax added up to about minus ₹356.5 Cr, but operating cash flow added up to about minus ₹2,401.3 Cr. Even in FY25 and FY26, the two profitable years, the company earned ₹886.7 Cr of profit after tax while operating cash flow came to minus ₹460.2 Cr, because trade receivables rose to ₹4,249.8 Cr.
The balance sheet has carried that gap with equity and debt. The company raised about ₹1,619.1 Cr through share issues in FY26, and net worth was ₹8,146.7 Cr in September 2026. Total borrowings rose from about ₹1,440.1 Cr in March 2025 to ₹2,473.7 Cr in September 2026, so collections from customers are the next test.
"Experience is what you got when you didn't get what you wanted."
— Howard Marks
Inox Wind's loss years taught it that turnkey projects can hold up cash for a long time. The move to equipment supply is its answer, and the cash flow statement is where that answer will show.
What FY28 Could Look Like on Management's Numbers
So where does the business go from here? In the November 2026 deck, management gave a target for FY28 of about ₹7,500 Cr of revenue, including other income, at an EBITDA margin of about 20%. The deck does not repeat the FY27 target of about 75% growth that management had given in February 2026.
Let's put that target against the past. FY26 total income was about ₹4,569 Cr. Reaching ₹7,500 Cr in FY28 would mean growth of about 64% over two years, or about 28% a year. That is slower than the 75% that management had planned for FY27 alone.

Management lists the steps behind that plan: commercial sales of the 4X turbines, more transformer and power-electronics manufacturing, a higher EBITDA at Inox Green after the Wind World consolidation, and a framework agreement for recurring orders from the group's power producer.
That list also tells us where the margin is meant to come from. O&M carries a higher margin than turbine sales, so a larger Inox Green inside the consolidated numbers would lift the group's EBITDA margin. So part of the FY28 target depends on the service arm, not only on selling more turbines. You should read the 20% margin target with that mix in mind.

Those commitments are easier to judge against the past. So let's check what management said before against what it delivered.

That record shows a clear pattern. The margin targets have been met or beaten for two years. The volume, revenue and working-capital targets have come in below plan, and the company changed the way it gives guidance twice in a year. The margin has been the stronger number, and the cash and the timing have been the softer ones.
Key Risks
Now let's look at what could go wrong for Inox Wind, because the latest half year has already shown some of these risks.
- Cash and receivables: operating cash flow was minus ₹598.1 Cr in FY26 and minus ₹462.3 Cr in H1 FY27. Receivables were ₹4,225.4 Cr in September 2026. If customers keep paying late, the company may need more borrowing or more equity.
- Rising debt: total borrowings rose from ₹1,551.5 Cr in March 2026 to ₹2,473.7 Cr in September 2026, and finance cost was ₹63.3 Cr in Q2 FY27. TReDS payables add another ₹381.9 Cr owed to financiers.
- Doubtful dues: the company set aside ₹136.3 Cr for expected credit losses in FY26 and ₹21.4 Cr more in H1 FY27. Management named payment delays on some public sector contracts.
- Raw-material costs: the gross margin went from about 44.3% to about 38.3% in a year as commodity prices rose. Older fixed-price orders could keep pressure on margins until new orders are priced higher.
- Guidance record: the FY26 revenue target was missed, and the FY27 growth target was not repeated in November. Investors may give less weight to the FY28 target until the company delivers.
- Leadership change: the Chief Executive Officer resigned on 13 November 2026, and a new Managing Director for the group's wind business took over the next day.
- Group dependence: a large part of future orders is planned to come from Inox Clean, a related company. If its plans slow, Inox Wind's order flow slows too.
- Audit matters: the auditor drew attention to funds placed in six project companies set up under a SECI tender, where the company gave bank guarantees of ₹55.8 Cr and is filing an appeal, and to ₹118.6 Cr of O&M services rendered but not yet billed. The parent also wrote back ₹43.8 Cr of customs duty on expired EPCG licences that are still under consideration.
- Competition: other makers are moving to 5 MW class turbines, and the 4.45 MW model is still to start commercial sales.
"On the receivable front, there has been some challenges, especially in our PSU contracts, where we have seen payment delays." - Sanjeev Agarwal, then Chief Executive Officer, May 2026
"All I want to know is where I'm going to die, so I'll never go there."
— Charlie Munger
For Inox Wind, the places to watch are clear: late payments, rising debt, costlier raw materials and a guidance record that has been mixed. The list below sets them out.
Explore our Products
Research Framework

Emerging Titans
Combination of quantitative analysis, industry tailwinds, and management assessment - SPRINT investment philosophy

Tiny Titans
Heavy emphasis on scuttlebutt research, plant visits, and early on-ground signals
What to Track Next
If you follow Inox Wind, these are the signals that will show where it goes next.
- Operating cash flow in H2 FY27, after minus ₹462.3 Cr in H1
- Trade receivables after ₹4,225.4 Cr, and receivable days after about 334
- Total borrowings after ₹2,473.7 Cr, and finance cost after ₹63.3 Cr a quarter
- The gross margin as new orders priced at current costs reach execution
- The share of equipment supply in the order book after 61%, and the order book after about 3.8 GW
- First commercial sales of the 4.45 MW turbine
- Group EBITDA after the Wind World O&M business is consolidated from Q3 FY27
For the other listed solar and wind companies, from glass and cells to turbines and power producers, see Renewable Energy Stocks in India 2026: Solar and Wind.
Compare: see how it measures up against its peers in Inox Wind vs Suzlon: Wind Turbine Makers Compared, a side-by-side look at order books, margins and balance sheets.
Conclusion
Let's put it all together. Inox Wind has gone from a loss of ₹712.4 Cr in FY23 to a profit after tax of ₹449.1 Cr in FY26, on revenue that grew about seven times from FY22. Its order book of about 3.8 GW and its group customer give it work for the next two years. The cautious thread is the cash, with operating cash flow at minus ₹462.3 Cr in H1 FY27 and borrowings up to ₹2,473.7 Cr. The next two quarters will show whether the shift to equipment supply brings receivables and debt down.
Still, the profit has not yet become cash. What happens next depends on whether the move to equipment supply brings receivables down, whether the margin recovers as new orders are priced at current costs, and whether operating cash flow turns positive.
FAQs
What does Inox Wind do?
+Inox Wind makes wind turbines, including blades, towers, nacelles and hubs, in five plants with about 2,500 MW of yearly capacity. It sells 2 MW and 3 MW class turbines and has a 4.45 MW prototype up in Gujarat. Through its subsidiaries it also builds wind farms and power lines and runs O&M services.
How did Inox Wind do in Q2 FY27?
+Revenue from operations rose 21.0% to ₹1,354.3 Cr. EBITDA including other income was ₹228.6 Cr, a margin of 16.6% on total income, against 23.3% a year ago, as material costs rose. Profit after tax was ₹68.6 Cr, against ₹120.6 Cr.
Why is Inox Wind's operating cash flow negative?
+Most of the gap comes from receivables. Trade receivables rose from ₹1,137.3 Cr in March 2024 to ₹4,249.8 Cr in March 2026, about 353 days of sales. In turnkey contracts, part of the payment comes only after commissioning, and some public sector contracts saw payment delays. Operating cash flow was minus ₹598.1 Cr in FY26 and minus ₹462.3 Cr in H1 FY27.
What is the difference between turnkey and equipment supply for Inox Wind?
+A turnkey contract means Inox Wind builds the whole wind farm and hands over a working project. An equipment supply contract means it only makes and delivers the turbines. In October 2026, 61% of third-party orders were for equipment supply, and management aims for about 75%.
What is Inox Wind's order book?
+The order book was about 3.8 GW in October 2026, against about 4.4 GW in July 2026, which included a 1.5 GW MOU with group company Inox Clean Energy. The company added 350 MW of orders in Q2 FY27, and management says the book gives revenue visibility of more than 24 months.
What are the main risks for Inox Wind?
+The main risks are slow collections and rising debt: total borrowings rose to ₹2,473.7 Cr in September 2026. Raw-material costs cut the gross margin to about 38.3% in Q2 FY27, the FY26 revenue target was missed, and the Chief Executive Officer resigned in November 2026.

High growth stock specialist, Value Educator
Shashank Mahajan is an equity research professional with over 12 years of experience in identifying high-potential SME and micro-cap stocks at an early stage. He follows a rigorous scuttlebutt research–driven approach, combining on-ground insights with deep financial analysis. Shashank specializes in uncovering under-researched and under-owned companies with strong management quality and long-term growth potential. Through disciplined research and early identification, he focuses on spotting tomorrow’s market leaders before they enter the mainstream investor radar.
More about Shashank Mahajan →
Azad Engineering vs MTAR vs Unimech: Aerospace Parts
Subros vs Lumax Auto vs Sona BLW: EV Auto Parts Compared
Jyoti CNC vs Macpower CNC: Machine Tool Makers Compared
Data Patterns vs Astra Microwave vs Apollo Micro

Himadri vs PCBL: Carbon Black and Battery Materials

Inox Wind vs Suzlon: Wind Turbine Makers Compared
Explore our Products
Research Framework
Emerging Titans
Combination of quantitative analysis, industry tailwinds, and management assessment - SPRINT investment philosophy
Tiny Titans
Heavy emphasis on scuttlebutt research, plant visits, and early on-ground signals



India's Aerospace Opportunity
Global Demand. Supply Bottlenecks. Opportunities Ahead.
Don't Miss This Exclusive Webinar!
Join Value Educator to decode the key trends shaping India's aerospace sector and learn how to identify tomorrow's potential leaders in the space.
- How the aircraft value chain works, layer by layer
- Indian companies supplying global aircraft makers
- A framework to judge any aerospace company

 Orders
 Subscription
 Share with friends


Required Details
₹23999.00
(12 month subscription)
As per SEBI regulations, all users are mandated to complete the KYC that is validated for 1 year. Post payment, you will be redirected to the KYC screen


No comments yet. Be the first to comment!