
Days Sales Outstanding (DSO) Explained
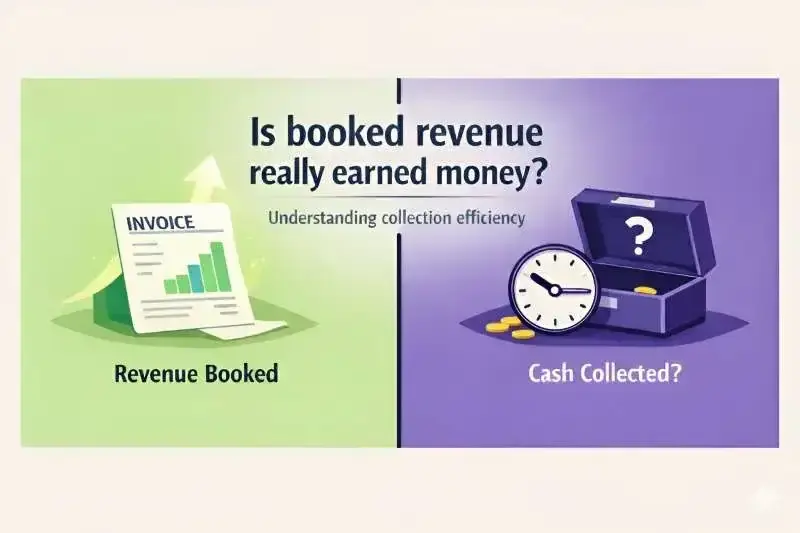
When a company reports rising revenue, has the money actually come in, or is it still waiting to be paid?
If the cash has not arrived yet, how confident should we really be about that growth?
How often do we celebrate higher sales without asking who is paying, when they are paying, and how dependable those payments are? If collections begin to fall behind sales, are we witnessing genuine strength or the quiet buildup of pressure beneath the surface?
If cash flow tells the real story, should we not question more than just the top line? Should we not ask how reliably a business turns its sales into money it can actually use?
This is where Days Sales Outstanding starts to matter. What does it reveal about discipline, bargaining power, and customer quality? And what truths might it uncover that revenue figures alone never show?
What DSO Really Measures
After a company makes a sale on credit, the transaction is recorded immediately, but the cash does not arrive at the same moment. This raises an important question: how long does the business actually wait before that revenue turns real?You can think of it as tracking how long revenue remains tied up as receivables before becoming usable cash. A shorter wait suggests operational discipline, while a longer wait invites questions about credit control and customer reliability.

Seen this way, DSO is not just a number but a reflection of how smoothly money circulates within a business. It captures the gap between selling confidently and collecting effectively, a gap investors often overlook.
The relationship can be expressed simply:
DSO = 365 / Receivable Turnover Ratio
This converts collection efficiency into days, allowing investors to visualise financial behaviour rather than interpret isolated ratios.
Understanding this also highlights a deeper distinction. Accounting profit recognises revenue when it is earned, but cash reflects when value becomes available to deploy, repay obligations, or expand operations.
As Charlie Munger often emphasised, “Take a simple idea and take it seriously.” Viewing DSO as waiting time instead of memorising formulas helps investors grasp its practical meaning.
Read how to interpret a balance sheet: How to Read a Balance Sheet Like a Professional Investor
Why DSO Matters More Than It Appears
At first glance, Days Sales Outstanding looks like just another operational ratio. But behind the number lies a deeper story about how comfortably a business breathes between selling and getting paid. Ignore it, and you risk mistaking recorded revenue for real financial strength.
- Liquidity is the most immediate consequence. When cash takes longer to arrive, even profitable companies can feel strained meeting obligations or seizing opportunities. As Warren Buffett has observed, “Cash flow tells you the truth” - because it reveals what actually enters the business, not what accounting promises.
- DSO also speaks to working capital efficiency. Faster collections mean money cycles back into operations quickly, supporting inventory, salaries, and expansion without relying heavily on external funding. Sluggish collections, on the other hand, quietly trap capital where it cannot contribute.
- Beyond operations, it signals customer quality and credit discipline. If a company’s DSO stays high for a long time, it might mean that the company struggles to get paid on time or deals with slow-paying customers. A lower, steady DSO usually shows better credit rules and stronger trust with clients.
- Reinvestment ability is directly shaped by this timing. When cash arrives sooner, management can redeploy it into innovation, capacity, or debt reduction. As Peter Lynch emphasised, “Growth is never free,” and liquidity often determines whether growth is internally funded or externally borrowed.
Ultimately, DSO connects to cash flow sustainability. Stable collections support predictable planning and resilience during downturns, while volatile or extended cycles introduce uncertainty. What seems like a minor ratio, therefore, reflects long-term financial durability.
To know more about returns, read our article on: The Rule of 72: The Simple Math Behind Doubling Your Money
Reading Between the Numbers — Interpreting High vs Low DSO
At first glance, a lower Days Sales Outstanding appears unquestionably positive. Faster collections suggest discipline, efficient processes, and customers who pay without friction. But should investors stop at that surface interpretation?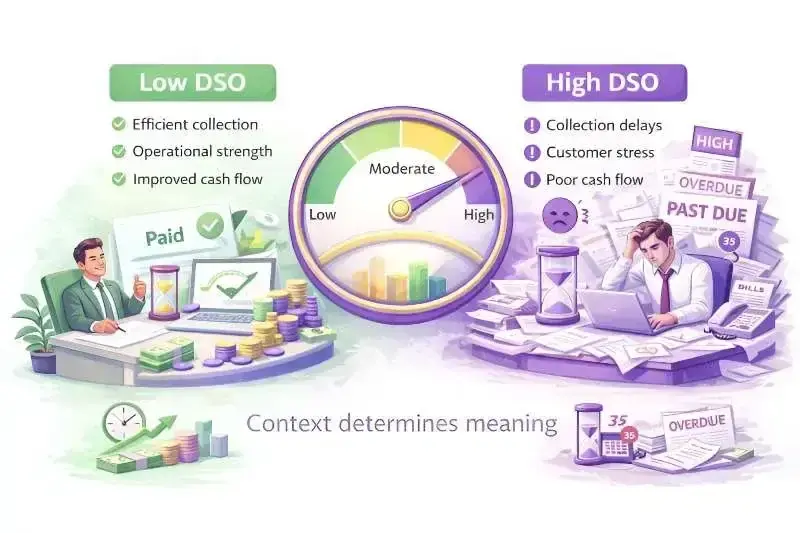
When DSO stays low, it usually shows the business is running well. Cash comes in fast, working capital moves smoothly, and the company can act quickly when opportunities or challenges arise. Here, speed shows good coordination, not just efficiency.
Yet an extremely low figure can raise a different question. Are strict credit policies discouraging potential buyers or limiting market reach? A company that collects instantly may also be trading away growth by being overly cautious.
On the other side, a high DSO frequently points toward collection challenges or customer strain. Payments stretching out may indicate weak credit control, declining customer quality, or broader financial stress within the customer base.
Still, context matters before drawing conclusions. Certain industries naturally operate on longer credit cycles, making comparisons meaningful only against sector norms rather than absolute numbers.
As Howard Marks reminds investors, “You can’t predict, but you can prepare.” Interpreting DSO thoughtfully means balancing signals with context instead of reacting to extremes.
To know about how stock prices are actually determined, read our article on: How Stock Prices Are Determined: The Role of Bid, Ask, and Spread
Industry Contrast: DSO Isn’t One-Size-Fits-All
It’s tempting to label a DSO number as efficient or concerning at face value. But can the same standard apply across businesses that operate on entirely different timelines and capital realities? Interpretation begins only when industry context enters the frame.Capital-intensive manufacturing often lives with longer collection cycles. Projects stretch over months, billing is milestone-based, and receivables accumulate before settlement. Firms like Larsen & Toubro operate in environments where patience is built into the revenue model rather than signalling inefficiency.
Asset-light technology services tell a different story. With lower physical capital requirements and contract-driven billing structures, collections typically move faster, and working capital turns quicker. For companies such as Infosys, a prolonged DSO would invite more scrutiny because operational structures allow for tighter cycles.
The contrast sharpens further when comparing infrastructure billing with retail activity. Large infrastructure engagements depend on staged payments and approvals, whereas retail transactions often settle immediately. Identical DSO readings across such sectors would carry completely different implications.
This is why benchmarking within industry boundaries matters. Numbers gain meaning only when placed beside peers facing similar credit norms and customer behaviour. Without comparison, ratios risk becoming labels detached from reality.
As Benjamin Graham cautioned, “The investor’s chief problem and even his worst enemy is likely to be himself.” Context reduces that risk by replacing assumptions with perspective.
Limitations of DSO: What It Cannot Tell You
Metrics create clarity, but they can also create overconfidence. Days Sales Outstanding offers direction, yet can one number fully represent the realities behind credit sales and customer behaviour?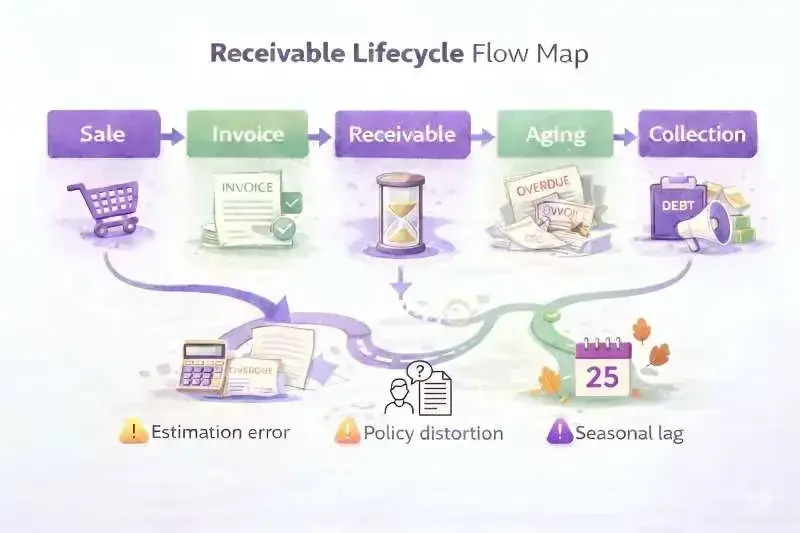
The first limitation begins with estimation. DSO often relies on approximating credit sales using aggregated receivable figures, which means it reflects calculated averages rather than precise transaction timing. Small shifts in estimation assumptions can influence interpretation.
Seasonal ups and downs can make DSO tricky to read. Companies with cyclical demand might look like they’re collecting fast or slow depending on the time of year, so short-term numbers can be misleading without looking at the bigger picture.
Accounting policies further complicate comparison. Differences in revenue recognition, provisioning, or receivable classification can reshape reported balances, causing similar operational behaviour to appear different across companies.
Finally, the metric lacks qualitative depth. It cannot reveal customer concentration risk, negotiation dynamics, or management intent behind credit terms. Interpretation, therefore, requires contextual judgement beyond numerical analysis.
As Howard Marks emphasises, “Being right may be less about what you see and more about how you interpret.” Numbers guide thinking, but thoughtful interpretation prevents false certainty.
To know more beyond this, read our article on: BVPS & Price to Book (P/B) Ratio: Identifying Asset-Based Value
Practical Mini Framework: How to Analyse DSO
A single DSO number rarely tells the whole story. The real insight comes when you ask questions, compare them over time, and see the bigger picture. Treat it as an indicator, not the final answer.As Peter Drucker once noted, “What gets measured gets managed.” The goal here isn’t just measurement - it’s interpretation. The following steps can be followed to analyse the DSO of a company:

1) Compare With Industry Peers
DSO only becomes useful when you see it in comparison with similar companies. Payment habits and credit rules differ a lot, so checking others helps you know if a number is good or worrying.For example, looking at Larsen & Toubro versus Infosys shows how the industry can affect how fast cash comes in. Context makes all the difference.
2) Examine the 3–5 Year Trend
A single snapshot hides direction. Observing the trajectory over several years reveals whether discipline is strengthening, slipping, or reacting to external pressures.Trend behaviour often tells a deeper story than the level alone. As Benjamin Graham emphasised, intelligent analysis focuses on patterns, not isolated figures.
3) Cross-Check With Cash Flow
Healthy collections should echo through operating cash flow. If accounting revenue grows while cash lags behind, the gap deserves scrutiny.Consistency between receivables movement and liquidity signals operational alignment. Disconnects may highlight risk long before headlines do.
4) Review Management Commentary
Annual reports and earnings calls frequently explain shifts in credit terms, client mix, or billing structure. These narratives provide clues that raw ratios cannot.Statements from leadership often clarify whether changes reflect strategy or stress. Listening to management interpretation completes the analytical picture.
5) Interpret Alongside the Business Model
When looking at DSO, start by understanding how the company earns and collects money. Subscription services, long-term projects, and immediate sales all have very different payment timelines. Always interpret DSO in the context of how cash actually flows through the business.So before judging the number, align it with the underlying model. Always interpret DSO in the context of how cash actually flows through the business.
Explore our Products
Research Framework

Emerging Titans
Combination of quantitative analysis, industry tailwinds, and management assessment - SPRINT investment philosophy

Tiny Titans
Heavy emphasis on scuttlebutt research, plant visits, and early on-ground signals
Conclusion
Without really understanding DSO, businesses often misjudge how quickly cash comes in, overestimate liquidity, or operate with inefficient collections. The result is usually the same - strained cash flow, missed opportunities, and reactive decisions instead of strategic planning. Simply making sales isn’t enough; monitoring DSO and aligning it with your customer payment cycles and business goals ensures cash flows smoothly, and your operations stay healthy.If this guide helped you clearly understand DSO and how it impacts cash flow and business efficiency, comment “DSO READY” below. Like if the examples clarified your thinking, share this with someone managing receivables, and tell us: what’s your current DSO or average collection period?
The real edge in business growth isn’t just increasing sales. It’s ensuring money comes in on time, operations stay funded, and your business can scale without cash crunches.
FAQs
Is a lower DSO always better?
+How can I bring down DSO?
+How often should I check DSO?
+Does DSO affect profits?
+Can DSO be different in different industries?
+Definitely. Some industries, like manufacturing, usually have longer payment cycles. Others, like retail or SaaS, get paid faster. It is important to compare DSO with similar companies in the same sector.

High growth stock specialist, Value Educator
Shashank Mahajan is an equity research professional with over 12 years of experience in identifying high-potential SME and micro-cap stocks at an early stage. He follows a rigorous scuttlebutt research–driven approach, combining on-ground insights with deep financial analysis. Shashank specializes in uncovering under-researched and under-owned companies with strong management quality and long-term growth potential. Through disciplined research and early identification, he focuses on spotting tomorrow’s market leaders before they enter the mainstream investor radar.

Zen Technologies: Revenue Fell After a Big Win




PNG Jewellers: A 194-Year-Old Name Goes National

Explore our Products
Research Framework
Emerging Titans
Combination of quantitative analysis, industry tailwinds, and management assessment - SPRINT investment philosophy
Tiny Titans
Heavy emphasis on scuttlebutt research, plant visits, and early on-ground signals


 Orders
 Subscription
 Share with friends


Required Details
₹23999.00
(12 month subscription)
As per SEBI regulations, all users are mandated to complete the KYC that is validated for 1 year. Post payment, you will be redirected to the KYC screen


No comments yet. Be the first to comment!