
Comparable Company Analysis (Comps)
_A_Relative_Valuation_Method .png)
Imagine paying ₹1.10 crore for a flat… only to later discover that similar flats in the same area recently sold for ₹80 lakhs.

Suddenly, that “decent layout” and “good building” don’t feel as comforting.
So before making any decision, you start checking.
One nearby building closed a deal at ₹80 lakhs.
Another slightly older one sold for ₹1.05 crore.
A recently renovated flat in the same lane went for ₹1.30 crore.
Now the question changes.
It’s no longer, “Is ₹1.10 crore expensive?”
It becomes, “Compared to what?”
Is this flat priced at a premium because it’s better maintained?
Is it slightly overpriced compared to recent transactions?
Or is the market quietly moving up, and this is actually fair value?
“Price is what you pay. Value is what you get.”- Warren Buffett
You’re not guessing. You’re benchmarking.
Investors do the exact same thing when valuing companies.
When a stock trades at ₹1,200, the real question isn’t whether ₹1,200 is high or low.
It’s whether that price makes sense relative to similar companies in the same industry.
This process of valuing a company by comparing it with similar publicly traded peers is called Comparable Company Analysis, or simply, Comps.
Value Through Comparison: What is Comparable Company Analysis?
Comparable Company Analysis, also known as “Comps,” is a relative valuation technique that helps investors gauge the market value of a company relative to similar companies in the market. Rather than attempting to determine the intrinsic value of a company, investors compare the market value of similar publicly traded companies and use it as a benchmark.
The basic concept is simple: if similar companies in the same industry are trading at a certain price multiple, it gives us a basis to compare whether another company is overvalued, fairly valued, or perhaps undervalued. Rather than questioning whether a price is high or low, Comps changes the perspective to how that price compares to its peers.
This approach is based on actual market data that reflects what investors believe to be the actual value of an investment. Price to Earnings and/ or Operating Ratios are examples of valuation multiples that demonstrate how much an investor will pay for the potential future growth, profitability, and quality of a company. This makes Comparable Company Analysis a useful tool for making sense of how the market is lining up one company against others.
But it is essential to keep in mind that Comps is a tool of comparison, not valuation. It does not attempt to inform us of the intrinsic or “true” value of a company. Rather, it assists us in asking better questions: is this company trading at a premium or a discount to others, and why?
Comparing companies may sound simple at first. But making that comparison meaningful requires a clear and structured approach. Let’s look at how this process actually works.
A Structured Framework for Comparable Company Analysis
Fundamentally, Comps (Comparable Company Analysis) is a step-by-step method used to understand how the market values businesses. In this process, you compare your company with similar companies and use their market valuations to estimate what your company might be worth.
Here’s how the process typically works.
Step 1: Select Comparable Companies
The first step in Comparable Company Analysis is identifying the right peer group.
Investors search for firms that have similar operating features, like industry, business model, size, growth, geography, and profitability. When you’re comparing companies, similarity matters a lot. The closer the businesses are in what they actually do, the more useful the comparison becomes.
Take an automobile company, for instance. If you’re trying to value it, you wouldn’t compare it with a tech startup or a bank. You would look at other car manufacturers such as Tata Motors, Mahindra & Mahindra, or Maruti Suzuki. Since they are in the same industry, it just makes more sense to compare them.
However, it is not enough to be in the same industry. Some companies may be more passenger car-oriented, while others may be more export-oriented or commercial vehicle-oriented. Such differences can have a huge impact on growth, margins, and risk.
Perfect comparables rarely exist. The goal is not to find identical businesses, but reasonably similar ones. This step requires judgment and it sets the foundation for the entire analysis.
“Everything should be made as simple as possible, but not simpler.”- Albert Einstein
Step 2: Gather Financial and Market Data
Once the peer group is selected, the next step is building a comparison table, often called a “comps table.”
This table typically includes:
- Share price
- Market capitalization
- Enterprise value
- Revenue
- EBITDA
- Earnings or earnings per share (EPS)
- Debt levels
By just posing this information, investors can compare the relative positioning of each company in terms of size, profitability, and market value.
There are several ways to gather this information. Professional analysts tend to use tools such as Bloomberg or Capital IQ, while individual investors tend to use tools such as Screener or other financial databases. These tools enable investors to set filters and screening criteria in order to rapidly gather financial information for a number of companies simultaneously.
In most cases, however, the use of automated tools is only the beginning. Key information, such as business mix or accounting differences, tends to require a review of annual reports and company filings. This is one of the more time-consuming aspects of the process, but also one of the most critical for accuracy.
One of the key concepts that apply in this case is the distinction between market capitalization and enterprise value. Market capitalization is simply the value of the equity. Enterprise value, however, includes debt and takes into account the cash position. Enterprise value is particularly helpful when comparing firms with different capital structures.
Step 3: Calculate Valuation Multiples
After organizing the financial and market data, the next stage is to convert that information into valuation multiples.
Multiples are ratios that help standardize comparison. Instead of looking at revenue or profit in absolute terms, investors examine how the market values each unit of performance. This allows for comparison among companies of different sizes.
Common valuation multiples that are used include:
P/E Ratio (Price/Earnings):
This ratio compares the market price per share with the company's earnings per share and shows how much investors are willing to invest for every dollar of profit earned by the company. To understand P/E in more depth, you can read our detailed article: The P/E Ratio Decoded: Trailing vs. Forward, and What is a "Good" P/E?
EV/EBITDA:
This multiple compares the total value of a company, including debt, to its operating earnings. It is especially useful when companies have different capital structures. If you’re unsure what EBITDA represents, here’s a complete breakdown of why investors use it: What is EBITDA? Why Investors Look at It (And Its Limitations).
EV/Sales
This ratio compares the value of the enterprise to its revenue. This ratio is usually used when the profitability is fluctuating or when the margins differ considerably among companies.
Price-to-Book (P/B)
This ratio is commonly used in banking and financial institutions. This ratio compares the market value to the book value. This ratio is particularly useful for companies that are driven by their balance sheets.
Read more on P/B in our article: BVPS & Price to Book (P/B) Ratio: Identifying Asset-Based Value
The essence of all valuation ratios is the same. It is the market's willingness to pay for a given measure of performance.
Using ratios to measure financial performance, rather than absolute numbers, provides a comparable basis.
“In investing, what is comfortable is rarely profitable.”- Robert Arnott
Step 4: Benchmark Against Peers and Derive a Valuation Range
Once the multiples are calculated, they are benchmarked across the peer group.
Investors usually consider the average or median multiple of similar companies. In most scenarios, the median multiple is preferred over the average multiple because it is less affected by outliers that might otherwise skew the analysis.
This benchmark multiple is then used to calculate the target company’s financial metric to derive an implied valuation.
For example, if similar companies in the market are trading at an average multiple of 20, and the company you are analyzing is making ₹100 crore, then applying the same multiple would give you a valuation of approximately ₹2,000 crore.
However, it is important to note that this does not give you one “perfect” number. Valuation is not an exact science, but an estimate based on how similar companies are currently being priced in the market. Instead, it generates a valuation range, a reference band within which the company might reasonably be valued relative to peers.
Step 5:Interpretation Where Real Analysis Happens
This is where the numbers become knowledge.
Multiples alone do not provide the full picture. The question is, what is the reason for these differences?
When one company is trading at a premium, there is probably a reason for that. Perhaps it is growing faster. Perhaps it has better margins. Perhaps it has a sustainable competitive advantage, a cleaner balance sheet, or is simply viewed as a safer business overall.
On the other hand, when a company is trading at a discount, the market is trying to tell you something too. Perhaps it is facing slower growth, operational issues, high debt, or uncertainty.
The multiple is simply the beginning of the story. It is what’s behind it that actually matters.
This stage requires qualitative understanding alongside quantitative comparison.
Valuation multiples show what the market is pricing.
Interpretation explains why.
So far, we’ve looked at how markets value listed companies relative to one another. But valuation comparisons can also be drawn from real acquisition deals.
Looking Beyond Market Prices: The Role of Transaction Multiples
So far, we’ve focused on how publicly listed companies are compared using trading multiples, essentially looking at how the market is pricing similar businesses today. But relative valuation can also be viewed through another important lens: actual acquisition transactions.

Transaction multiples are derived from real-world deals where one company acquires or merges with another. Rather than focusing on the trading prices in the market, this method considers the points at which buyers acquired control of the business.
For instance, if a firm operating in a given industry was acquired at a multiple of 12 times EBITDA, this multiple can be used as a guide when analyzing similar firms.
The main difference is in perspective. Trading multiples show what investors are ready to pay in the market, which can be driven by market sentiment, market liquidity, and short-term market expectations. Transaction multiples, on the other hand, typically include a control premium, which is the amount of money that acquirers are ready to pay in order to own and control the company.
As a result, transaction multiples are typically higher than trading multiples. They may also be motivated by strategic drivers such as synergy, growth potential, and market positioning, which may not be captured in standalone financial performance.
For those who are not familiar with the subject matter, the easiest way to describe the difference is:
- Trading comparables show how the market values companies today.
- Transaction multiples show how acquirers have valued similar businesses in real deals.
Together, they provide another layer of perspective, helping investors understand valuation not just from market pricing, but also from the standpoint of strategic buyers.
The concepts may sound structured on paper. But how does this actually look when applied to real companies?
A Quick Practical Look: Comparing Cement Companies
It’s one thing to understand Comparable Company Analysis in theory. It’s another to actually see how it works.
“The four most dangerous words in investing are: this time it’s different.”- Sir John Templeton
So let’s take a real industry cement and walk through a simple comparison.
If you see the Indian cement industry, there are quite a few listed companies: UltraTech Cement, ACC, Ambuja Cement, Shree Cement, Dalmia Bharat, and a few more. Rather than studying the whole industry, let’s consider three of them to make it simpler:
- UltraTech Cement
- Shree Cement
- Dalmia Bharat
They all manufacture cement. They operate in the same country. They deal with similar demand cycles, input costs, and industry pressures. That makes them reasonable peers for comparison. Since cement is a cyclical industry, understanding industry cycles becomes important.
Read More in our article: Understanding Industry Cycles: Circulation vs. Consumption Stocks: Which Type is More Recession-Proof?
Now, before thinking about valuation, let’s just look at the businesses themselves.
What Do the Numbers Look Like?
Here’s a basic financial snapshot:
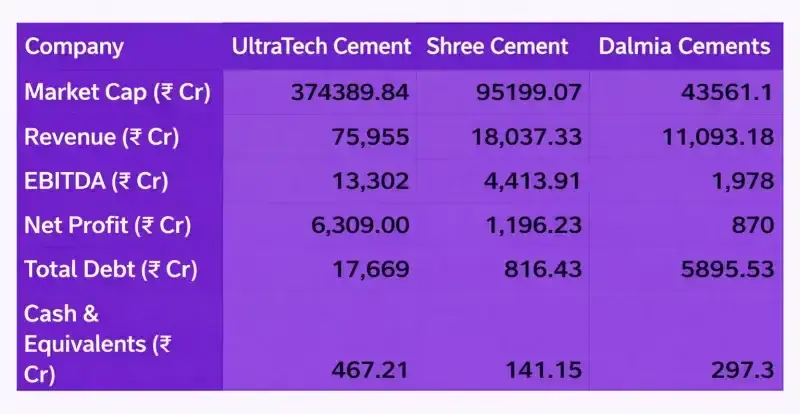
Just looking at this table, a few things stand out.
UltraTech is operating at a completely different scale. Its revenue base is far larger. Its profit numbers are also significantly higher. Shree Cement and Dalmia Bharat are smaller in comparison, though still substantial players within the industry.
At this stage, we’re not making any conclusions. We’re just laying things out side by side. That’s the starting point of comps clarity before judgment.
Here’s where it gets interesting.
When we look at valuation multiples:
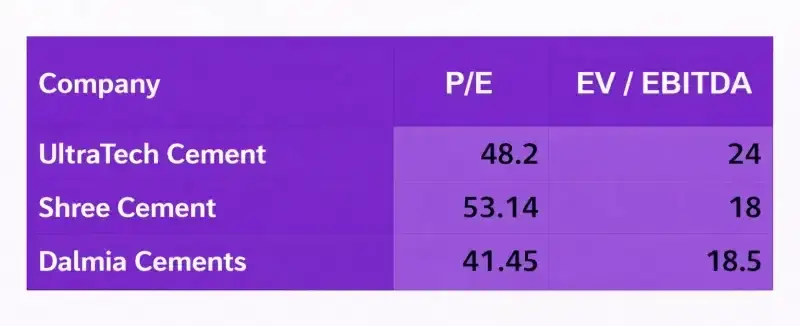
Despite being in the same industry, these companies do not trade at the same multiples.
Shree Cement has the highest P/E ratio among the three. Dalmia Bharat has the lowest P/E ratio. UltraTech Cement is in between. EV/EBITDA ratios are also different for the three companies.
What does this information imply?
P/E ratios of the three companies are roughly between 41x and 53x. EV/EBITDA ratios are roughly between 18x and 24x.
This range becomes our reference point.
If a company is trading at the higher end of the range, we say that it is trading at a premium relative to its peers. And if a company is trading at the lower end of the range, it is trading at a discount.
But here’s the key part: premium does not necessarily mean overvalued. And a discount does not necessarily mean undervalued.
The market may be reflecting more optimistic growth views, greater cost efficiency, greater stability of margins, or even lower perceived risk. Alternatively, lower multiples may be reflecting different views or simply a different market perception.
Comparable Company Analysis doesn’t give you a final answer. It doesn’t say “buy” or “avoid.”
What it does is put companies in context.
Instead of looking at one stock in isolation, you see where it stands relative to others that operate in the same space. And that relative positioning often raises better questions than looking at a single number ever could.
While comps provide useful relative context, no valuation framework is perfect. Understanding its advantages and limitations is just as important as knowing how to apply it.
The Strengths and the Blind Spots of Comps
Why Comps Is So Widely Used
Fast and Intuitive: Once peer data is available, comparisons can be made quickly. Even beginners can understand relative pricing once companies are placed side by side.
Market-Based:
Comps reflect real-time investor expectations. They show how the market is currently pricing risk, growth, and profitability.
Widely Used Professionally:
Investment bankers, equity analysts, private equity firms, and institutional investors all rely on comps. It’s a standard part of professional valuation practice.
Strong Starting Benchmark:
Before building complex valuation models, comps provide a useful reference range. They help answer: “Is this company broadly in line with its peers?”
Helpful for Screening:
Comps are particularly useful for narrowing down investment ideas. Premiums and discounts can quickly highlight where deeper analysis may be required.
Reflects Industry Positioning:
Because comps are relative, they reveal how companies are positioned within their sector leaders, challengers, or laggards.
Where Comps Falls Short
No Perfect Comparables Exist:
Even companies in the same industry can differ meaningfully in scale, geography, margins, or strategy. Judgment is always required.
Market Sentiment Influences Multiples:
Multiples are affected by optimism and pessimism. If the market is overly bullish or bearish, comps will reflect that sentiment.
Entire Sectors Can Be Mispriced:
If an entire industry is overvalued or undervalued, comps will not detect it. All companies may look “fair” relative to one another even if the sector itself is distorted.
Accounting Differences Matter:
Variations in accounting policies, depreciation methods, or one-time adjustments can distort comparisons.
Growth Differences Complicate Comparison:
Two companies in the same sector may have very different growth trajectories. A simple multiple may not fully capture that nuance.
Not an Intrinsic Valuation Method:
Comps do not estimate a company’s fundamental or intrinsic value. They only show relative pricing within a peer group.
“The stock market is a device for transferring money from the impatient to the patient.”- Warren Buffett
The Core Truth
Comparable Company Analysis shows how markets are pricing companies, not necessarily what those companies are truly worth.
And that distinction matters.
Used thoughtfully, comps provide powerful context. Used blindly, they can reinforce existing market biases.
Explore our Products
Research Framework

Emerging Titans
Combination of quantitative analysis, industry tailwinds, and management assessment - SPRINT investment philosophy

Tiny Titans
Heavy emphasis on scuttlebutt research, plant visits, and early on-ground signals
Conclusion: Seeing Value in Context
Comparable Company Analysis ultimately shifts the way we think about valuation. Instead of asking whether a stock price looks high or low in isolation, it encourages us to ask a better question: how does this company compare to others operating in the same space? By benchmarking performance, scale, and valuation multiples, comps help investors see where a business stands within its industry rather than viewing it alone.
At the same time, comps is not a shortcut to certainty. It reflects how markets are pricing companies today, influenced by expectations, sentiment, and sector trends. It does not claim to reveal intrinsic value, but it does provide perspective. And in investing, perspective often matters more than precision. When used thoughtfully, comps become a powerful starting point for deeper analysis.
If this breakdown helped you understand valuation a little more clearly, drop the word “Comps” in the comments. And if you’d like to see more practical finance concepts explained in a simple, structured way, let us know in the comments down below, and we’ll break them down one by one.
FAQs ( Frequently Asked Questions )
Is Comparable Company Analysis suitable for beginners?
+Yes. In fact, it is one of the easiest valuation methods to understand because it relies on comparison rather than complex forecasting. However, selecting the right peer group requires judgment and basic financial understanding.
Does a high P/E ratio always mean a stock is overvalued?
+Not necessarily. A higher multiple may reflect stronger growth expectations, better profitability, or lower perceived risk. Comps helps you see whether a multiple is high relative to peers, not whether it is “wrong.”
What is the difference between Comps and Intrinsic Valuation?
+Comps is a relative valuation method. It compares a company to others in the same industry. Intrinsic valuation methods, such as DCF, attempt to estimate the company’s true or fundamental value based on future cash flows.
Why are transaction multiples usually higher than trading multiples?
+Because acquisition deals often include a control premium. Buyers are willing to pay extra to gain ownership and strategic control, which is not reflected in normal stock market prices.
Can an entire sector look fairly valued using Comps but still be expensive?
+Yes. If an entire sector is overpriced due to optimism or strong sentiment, Comps may show all companies trading at similar multiples. Relative comparison does not automatically mean absolute value.

High growth stock specialist, Value Educator
Shashank Mahajan is an equity research professional with over 12 years of experience in identifying high-potential SME and micro-cap stocks at an early stage. He follows a rigorous scuttlebutt research–driven approach, combining on-ground insights with deep financial analysis. Shashank specializes in uncovering under-researched and under-owned companies with strong management quality and long-term growth potential. Through disciplined research and early identification, he focuses on spotting tomorrow’s market leaders before they enter the mainstream investor radar.

Zen Technologies: Why Revenue Fell After Its Biggest Win

Data Patterns: India's Radar Designer and Its Waiting Orders

KSH International: The Wire Inside India's Transformers

Krishna Defence: The Steel Behind India's Warship Hulls

PNG Jewellers: A 194-Year-Old Name Goes National

Axiscades: From Services to Missile and Radar Electronics
Explore our Products
Research Framework
Emerging Titans
Combination of quantitative analysis, industry tailwinds, and management assessment - SPRINT investment philosophy
Tiny Titans
Heavy emphasis on scuttlebutt research, plant visits, and early on-ground signals


 Orders
 Subscription
 Share with friends
 Logout


Required Details
₹23999.00
(12 month subscription)
As per SEBI regulations, all users are mandated to complete the KYC that is validated for 1 year. Post payment, you will be redirected to the KYC screen


No comments yet. Be the first to comment!