
P/E Ratio: Trailing vs Forward Explained

In early 2021, investors were looking at two paint companies.
Asian Paints was trading at a P/E many called unreasonable, well above the market average.
It was already the market leader, already expensive, already “fully priced.”
Berger Paints, on the other hand, was trading at a noticeably lower P/E.
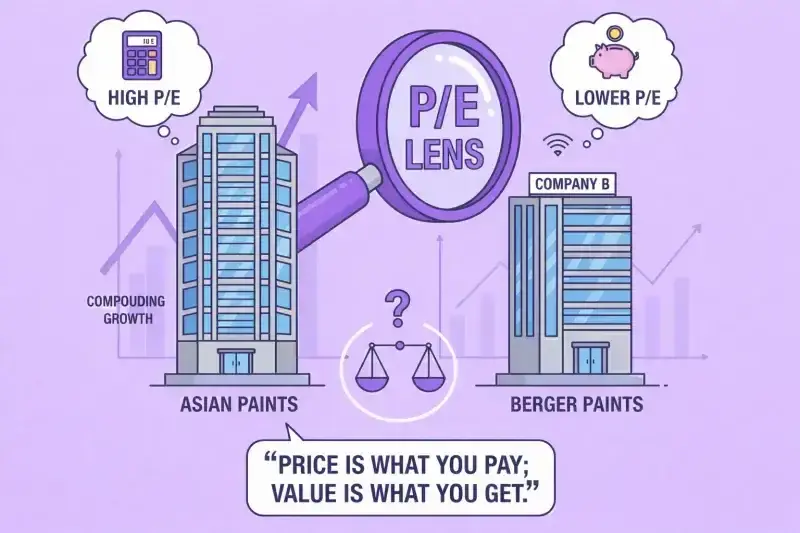
Same industry. Same demand cycle. Solid brand.
It felt like the safer, more sensible choice.
Many investors picked the lower P/E stock, confident they were being disciplined.
“Price is what you pay; value is what you get.” - Warren Buffett
Over time, Asian Paints continued to compound, while the gap between perception and reality slowly showed up in returns.
The lesson wasn’t that one company was good and the other was bad.
It was that a P/E ratio only makes sense when you understand what it’s reflecting, past earnings, future expectations, or something in between.
What You’re Really Paying for a Stock
The P/E ratio, also referred to as the Price-to-Earnings ratio, is one of the most popular measures investors rely on while trading stocks, but its true meaning is not well understood. It is essentially "the ratio at which you pay for one share against the earnings you earn on one share." So, "one rupee you pay for every one rupee of earnings."
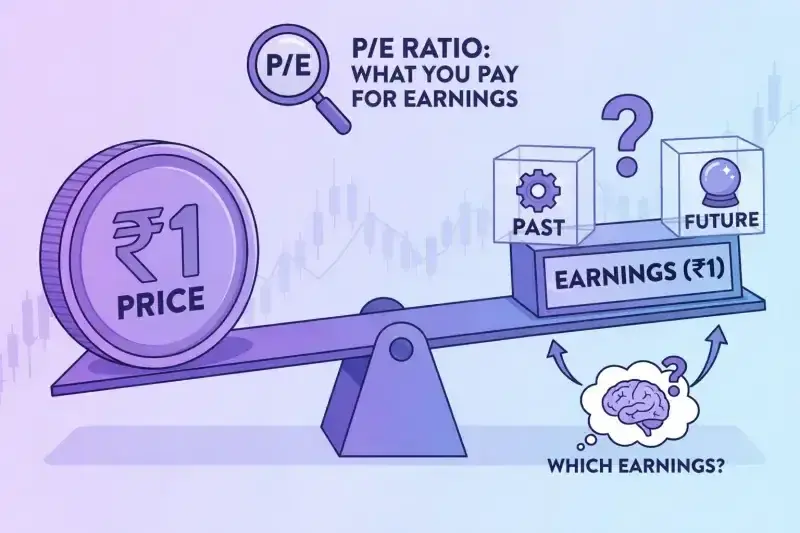
“The market is a device for transferring money from the impatient to the patient.” - Warren Buffet
However, the P/E ratio is not just any ordinary computation; besides showing what the stock price expects in the future in terms of growth and profitability, it includes the way that the investors as a group view the future of the company in terms of these characteristics. When the P/E ratio is high, chances are that the future holds great growth for the company.
Read More about Ratios in our article: How to Read a Balance Sheet Like a Professional Investor
The importance of understanding this concept is that it is of vital importance to linking the P/E ratio with the quality of a stock and whether it is overpriced or not, and most importantly, without understanding that the value is arrived at based on some factors, one is very likely to make the wrong conclusion and lose some cash.
Understanding what a P/E actually reflects ,the price the market is willing to pay for a unit of earnings ,is only the first step. The next question is: what earnings are we referring to? Are we referring to what the company made in the past? Or what we think the company is going to make in the future? The answer to that question is obviously important because it clarifies whether we’re referring to the past or to the future.
Looking Back or Looking Ahead? The Two Faces of P/E
Every P/E ratio is built on earnings, but not all earnings are created equal. There are two ways to calculate them, and each gives investors a slightly different perspective.
Trailing P/E is based on reported historical earnings, which the company has already made in the past. It is grounded in facts and audited results, giving a clear picture of how profitable the business has been.
Read More: What is Value Investing? Complete Guide for Beginners
Forward P/E, on the other hand, is based on expected future earnings. Analysts project what the company is likely to earn in future years, and then they compare the current price to these expected earnings. This version is more forward-looking, reflecting the optimism or caution embedded in the market.
“The stock market is forward-looking; it discounts the future, not the past.” - Benjamin Graham
The core distinction is simple: trailing P/E looks backward, forward P/E looks ahead. Both numbers are useful, but they tell different stories. Understanding which one you’re using, and why, is essential before making any judgment about whether a stock is expensive or cheap.
Looking Back vs Looking Ahead: What Titan’s P/E Really Reveals
Titan Company Limited is a branded consumer retail company with a focus on jewellery, watches, eyewear, and lifestyle accessories. It has demonstrated growth through its strong brand positioning, growth in organised retailing, and premiumisation in consumer discretionary retail. Companies like Titan are not valued based on their past performance alone but are usually evaluated considering their future prospects as well.
Therefore, it would not be inappropriate to place this company in this context to explain how different results are obtained based on different forms of the PE ratio formula.
“Growth is never by mere chance; it is the result of forces working together.” - James Cash Penney
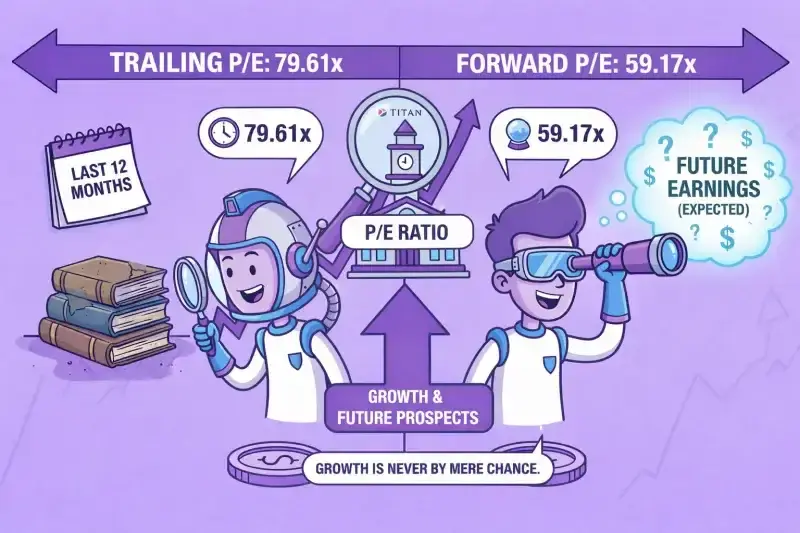
Current P/E for Titan stands at approximately 76.6x. This figure may seem quite high with regard to general financial valuation criteria. The actual value represents how much an investor is prepared to pay for a single unit of earnings, but to understand what exactly lies behind such a value, one would have to understand the actual measurement criteria for P/E itself.
The trailing P/E, which is approximately 79.61x, makes use of the last twelve months of earnings. This P/E is a backward-looking approach since it uses historical data. In this regard, the trailing P/E shows what the company has been able to achieve so far, and on this basis, one might consider the stock highly priced since the present price compares with past income.
However, upon considering the expected future earnings, there are changes to the interpretation of the valuation. Titan’s forward P/E multiple, which will be closer to 59.17x, actually considers the projected future earnings and not the historic results. This smaller multiple indicates a belief that future earnings are expected in the coming periods, hence the decrease in the valuation multiple.
The difference between these two figures brings to fore what essentially differentiates forward P/E ratios from trailing P/E ratios. Unlike the trailing P/E ratio, which is based purely on past performance, this ratio is based purely on future growth. In this case, therefore, like in the previous examples, when applied to Titan, the high disparity between trailing and forward P/E ratios shows how a high P/E ratio in relation to trailing earnings can be sensible.
Understanding the difference between trailing and forward P/E reveals that valuation is rarely absolute. This naturally leads to a deeper question: if P/E changes meaning depending on context, is there really such a thing as a universally “good” P/E ratio?
What Makes a “Good” P/E? Understanding Through the FMCG Sector
The idea of a “good” P/E ratio becomes clearer when viewed within the context of an industry rather than through a single number. The FMCG industry provides a good example, as firms in this industry are known to be trading at a high multiple due to the stable demand, predictable earnings, and strong competitive advantages driven by brands.
“It’s not whether you’re right or wrong, but how much you make when you’re right.” - George Soros
One of the leaders in the industry, Hindustan Unilever Limited (HUL), is currently trading at a P/E of around 49.6x, with a trailing P/E of 53.56x and a forward P/E of 52.91x. At first glance, this may appear expensive compared to several peers. For example, ITC trades closer to ~19x, while other companies within the broader FMCG space show varying multiples depending on growth, size, and profitability profiles. Even the peer group median, around ~44x, suggests that HUL trades at a premium within its own industry.
However, to interpret the premium, one has to go beyond the number. A higher multiple in FMCG may be driven by factors such as brand, pricing power, consistency, and the ability to generate stable earnings. Investors may be willing to pay a premium for companies with strong distribution channels, stable cash flows, and visibility on growth. In this scenario, a higher P/E ratio does not necessarily imply that a company is overvalued. It merely captures market views on business quality and the durability of earnings.
Read More: Top Undervalued Stocks in India Based on PE, PB & ROE
This example highlights that a “good” P/E ratio is not defined by a universal threshold. Rather, it is shaped by industry norms, peer comparisons, growth expectations, and qualitative factors that influence investor perception.
Understanding valuation, therefore, requires context — a principle that becomes essential when deciding when the P/E ratio works effectively and when it may become misleading.
The Right Context for Using P/E
The P/E ratio works best when it compares like with like. When companies operate within the same industry, follow similar business models, and face comparable growth drivers, differences in P/E often reflect how the market views relative quality and future expectations rather than structural differences.This is why the ratio is most useful in sectors with relatively stable and predictable earnings. In cases where profits are steady, a comparison of what investors are prepared to pay to receive these profits is more relevant.
“Risk comes from not knowing what you’re doing.” - Warren Buffett
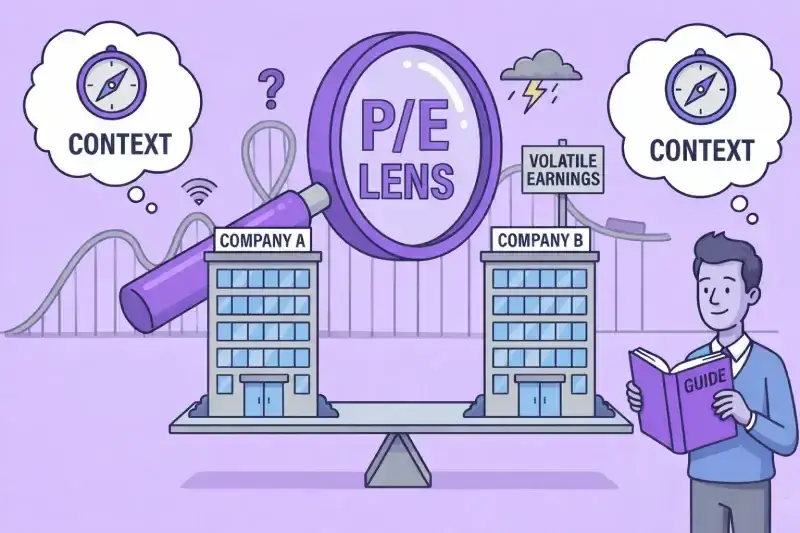
But the usefulness of P/E ratios starts to diminish when the underlying earnings are volatile. Businesses with cyclical earnings can appear either cheap or expensive depending on the point in the economic cycle, and one-shot benefits, accounting tricks, or excessive leverage can skew the earnings figures, making the P/E ratio unreliable.
There are of course, other sectors too, where earnings alone are not the only solution. Financial sector companies are better evaluated on balance sheet parameters, and companies that are yet to turn profitable or are currently losing money may not have a PE at all!
Read More: Technical vs Fundamental Analysis – Which One Should You Follow?
Finally, the P/E ratio is best used as a guide rather than an answer in and of itself. It provides a useful lens for valuation, but only when applied within the right context and alongside an understanding of how earnings are generated.
What the P/E Ratio Really Teaches Us
The "P/E ratio" is sometimes viewed as a simple tool for determining whether or not a given stock is "inexpensive" or "expensive," but its actual power rests on interpretation, not on the figures themselves. The "trailing" P/E measures what a given company has managed thus far, while the "forward" P/E looks at what the future might hold for that company. Understanding valuation means asking what the market is pricing in, not just reacting to whether a multiple looks high or low.
As seen through examples like Titan, a “good” P/E is never universal. Peer comparison, growth visibility, industry dynamics, and earnings quality all shape how a valuation should be interpreted. The ratio works best as a starting point,
a lens to ask better questions, rather than a final answer about whether a stock is worth buying or avoiding.
If this breakdown changed how you look at P/E ratios, comment “P/E” below. Share it with someone who still judges stocks only by high or low multiples, and tell me, do you look at trailing or forward P/E first when analysing a company?
Explore our Products
Research Framework

Emerging Titans
Combination of quantitative analysis, industry tailwinds, and management assessment - SPRINT investment philosophy

Tiny Titans
Heavy emphasis on scuttlebutt research, plant visits, and early on-ground signals
FAQs
Is a low P/E ratio always better?
+Not necessarily. A low P/E may indicate undervaluation, but it can also signal weak growth expectations, business risks, or declining profitability. Context matters more than the number itself.
What is the main difference between trailing and forward P/E?
+Trailing P/E uses historical earnings, while forward P/E uses projected future earnings. The former reflects past performance, while the latter reflects market expectations.
Why do some high-quality companies trade at high P/E ratios?
+Investors may be willing to pay higher multiples for businesses with strong growth visibility, brand strength, consistent execution, or durable competitive advantages.
Can P/E ratios be compared across industries?
+Generally no. Different sectors have different growth profiles, capital structures, and risk levels, which means valuation multiples vary widely between industries.
When does the P/E ratio become unreliable?
+P/E can mislead when earnings are volatile, heavily influenced by debt, affected by one-time events, or negative altogether.
Why is P/E not commonly used for banks and financial institutions?
+Financial companies are often better evaluated using balance-sheet metrics like price-to-book because asset quality and capital structure play a larger role than earnings alone.

High growth stock specialist, Value Educator
Shashank Mahajan is an equity research professional with over 12 years of experience in identifying high-potential SME and micro-cap stocks at an early stage. He follows a rigorous scuttlebutt research–driven approach, combining on-ground insights with deep financial analysis. Shashank specializes in uncovering under-researched and under-owned companies with strong management quality and long-term growth potential. Through disciplined research and early identification, he focuses on spotting tomorrow’s market leaders before they enter the mainstream investor radar.

Glenmark: The USD 700 Mn Cancer Deal and Its Brands

Pharma Stocks in India 2026: Generics, APIs and CDMOs

Granules India: From Paracetamol to a 65% Gross Margin

Natco Pharma: After Revlimid, 29 Patent Challenges

Shilpa Medicare: Cancer APIs, Films and Biosimilars

Alembic Pharma: US Plants Pay Back, Margin Hits 22.2%
Explore our Products
Research Framework
Emerging Titans
Combination of quantitative analysis, industry tailwinds, and management assessment - SPRINT investment philosophy
Tiny Titans
Heavy emphasis on scuttlebutt research, plant visits, and early on-ground signals



India's Aerospace Opportunity
Global Demand. Supply Bottlenecks. Opportunities Ahead.
Don't Miss This Exclusive Webinar!
Join Value Educator to decode the key trends shaping India's aerospace sector and learn how to identify tomorrow's potential leaders in the space.
- How the aircraft value chain works, layer by layer
- Indian companies supplying global aircraft makers
- A framework to judge any aerospace company

 Orders
 Subscription
 Share with friends


Required Details
₹23999.00
(12 month subscription)
As per SEBI regulations, all users are mandated to complete the KYC that is validated for 1 year. Post payment, you will be redirected to the KYC screen


No comments yet. Be the first to comment!