
BVPS and Price-to-Book Ratio Explained
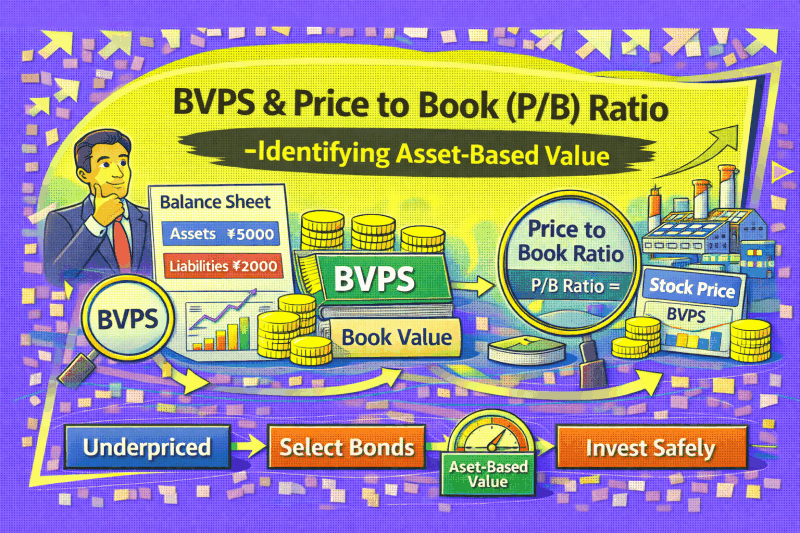
“In investing, what is comfortable is rarely profitable.” - Robert Arnott
How often do you look at a stock price and assume if you are buying at a good price or if it is overpriced?
What actually supports that price beneath the surface? Are there any assets backing each share, or is the valuation driven mainly by expectations about the future created by FOMO or hype?
Could some companies be quietly undervalued simply because markets are distracted? Or are others appearing attractive while trading far above what their recorded worth suggests?
Book Value Per Share and Price to Book don’t give ready-made answers. They simply help investors question whether the price reflects real value or just market hype.

What Book Value Really Means
Book value answers a very grounded question — if a business shut down today, what would remain for shareholders after settling everything it owes? It captures the capital that has been built and retained inside the company over time.
This measure becomes especially relevant in industries where operations rely on physical scale rather than just ideas or code. Factories, machinery, land, and infrastructure contribute directly to what appears on the balance sheet.
Think about National Aluminium Company Limited (NALCO). It owns mines, refineries, smelters, power plants, and transport facilities. All these things show the real size of the company and how that gets reflected in the value each shareholder owns.

But this makes you stop and think. Do these recorded assets really create value for shareholders, or are they sometimes just numbers on a page?
Unlike the stock price, which jumps around every day with news, sentiment, or speculation, book value only changes when the company updates its financial statements. It usually gets revised every quarter or year, so it moves slowly and gives investors a steadier reference point.
Book value ultimately describes financial structure, not business performance. Recognising this distinction helps investors avoid assuming that asset presence automatically implies value creation.
Read more about understanding balance sheets in our article: How to Read a Balance Sheet Like a Professional Investor
From Book Value to BVPS — Ownership Per Share
Book Value Per Share (BVPS) simply tells you how much of a company’s net worth is backing each individual share you own.“The stock market is filled with individuals who know the price of everything, but the value of nothing.” – Philip Fisher
Total book value can look impressive on paper, but what does that really mean for someone holding a single share? Does scale automatically translate into security, or does ownership need to be examined more closely?
BVPS takes the company’s total value and spreads it across all the shares. It shows exactly how much of that value is behind each individual share. Instead of looking at how big the company is, it helps you see how much each shareholder actually owns
Consider State Bank of India, where the scale of lending and asset depth makes per-share backing central to interpretation. In banking and asset-heavy sectors, tangible balance sheet strength often influences valuation because assets directly support operations and risk absorption.
Contrast this with Infosys, where valuation strength often stems less from physical assets and more from earnings power, intellectual capital, and scalability. In such sectors, markets place greater emphasis on profitability and growth expectations than on recorded asset backing.

So the answer lies in business models. Industries built on capital and infrastructure naturally emphasise tangible backing, while knowledge-driven sectors derive value from capabilities that accounting statements capture only partially.
“ Investing isn’t about owning companies in theory — it’s about knowing what your one share actually represents.”
BVPS helps investors see things clearly by looking beyond how big a company appears and focusing on what each share actually represents.
Understanding Price to Book Value
When you look at a stock price, have you ever wondered what it is actually being compared to? Price to Book Value answers that by showing how many times a share trades relative to the accounting value behind it. It turns valuation into a simple multiple you can relate to.
At its core, the ratio compares two numbers. One comes from the market where buying and selling decide the share price. The other comes from financial statements, where net worth per share is recorded.
Book value per share shows how much net asset backing is assigned to one share based on the company records. It comes from total shareholder equity divided by outstanding shares. In short, it represents the accounting value attached to each unit.
Market price, on the other hand, is set through trading activity. It reflects what participants are currently willing to pay for that share. Price to Book links this traded price with the recorded per share value.
Read more about what the price-to-earnings ratio is in our article The P/E Ratio Decoded: Trailing vs. Forward, and What is a "Good" P/E?
The calculation is direct. Share price is divided by book value per share. The result shows how many times the share is trading compared to its accounting backing.
Take HDFC Bank as a practical example. Its book value per share is around ₹364.24, which represents the accounting net asset backing attached to each share. Recently, the stock has been trading near ₹925 in the market.
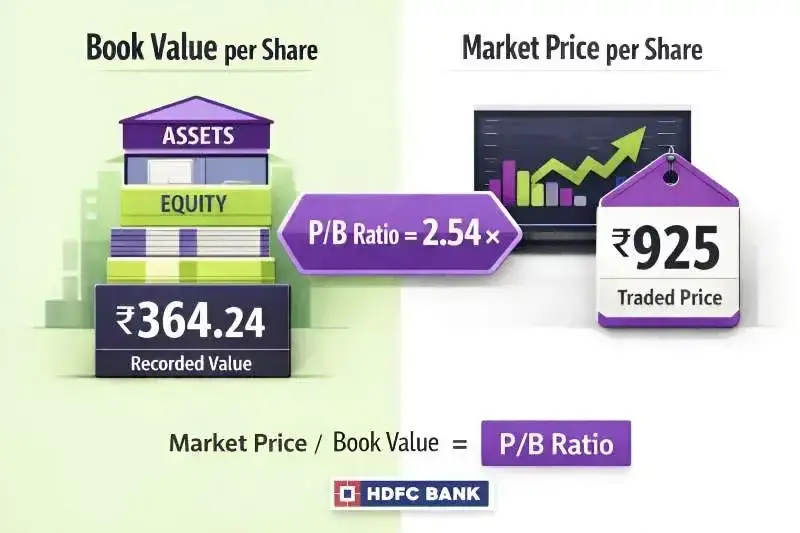
With a Price to Book ratio of about 2.54, the share is being valued at roughly 2.54 times its recorded backing. This multiple simply expresses how the traded price relates to book value per share.
Viewing both together places market pricing and accounting value in one frame. Instead of seeing price and book value separately, the ratio answers a direct question. How many times is each share being priced relative to the value recorded behind it?
When Low P/B Can Mean Opportunity — or Caution
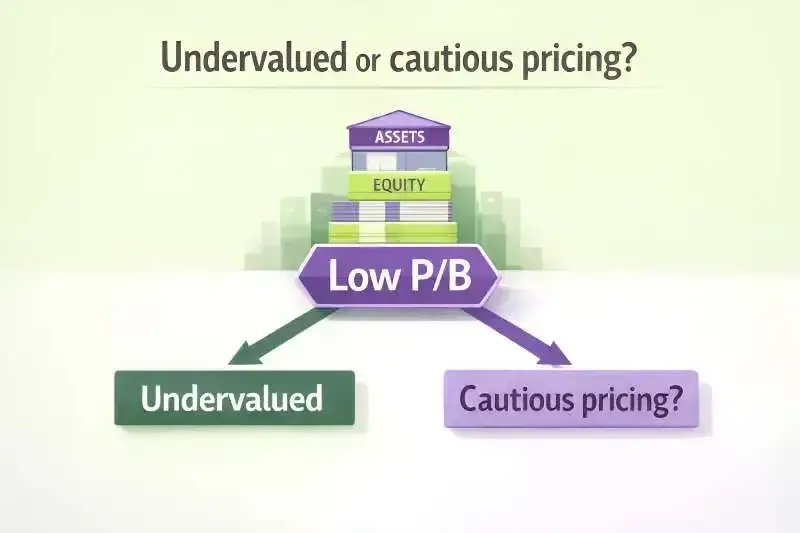
A low Price to Book ratio often appears in industries that move through cycles. During uncertain periods, stock prices can drift closer to the recorded asset value even when operations remain steady. This reflects caution in sentiment rather than immediate weakness, but it also invites a closer look rather than a quick judgment.
A low P/B may indicate that a stock is undervalued relative to its assets, or it may show that investors are conservative about future growth expectations. The ratio itself doesn’t give the answer it simply signals a situation worth investigating. To really understand a stock, you need to look at how much demand there is for its products, how profitable it is, and how strong it stands in its industry.
Take Coal India as an example. India still relies heavily on coal for electricity, and the company owns extensive mining and infrastructure assets to meet that demand. At the same time, market pricing sometimes reacts to discussions about cleaner energy. This doesn’t change today’s demand, but it can influence what investors expect for the future. Separating current reality from long-term expectations is key, using production, domestic consumption, and cash flows to provide a grounded context beyond just the P/B ratio.
At the same time, low P/B can reflect real structural concerns. A company may look solid on paper with buildings, machinery, or other assets, but if those assets aren’t generating sufficient returns, the market may price the stock lower. Changes in technology, regulation, or poor management decisions can reduce the efficiency of assets and the company’s ability to create value.
The takeaway is clear: a low P/B ratio is not a guaranteed bargain. It can signal an opportunity, or it can reflect persistent challenges the market is aware of. Observing the business fundamentals, industry trends, and financial performance alongside the ratio provides the full picture and helps investors make smarter, more informed decisions.
When Does a High P/B Reflect Quality — and When Does It Signal Risk?
Sometimes a stock trades at a high Price-to-Book because the business has shown it can use its money well and grow steadily over time. Investors are willing to pay more than the accounting value because they trust how the company operates.
Things you don’t see clearly on the balance sheet also matter: a strong brand, wide distribution, loyal customers, and consistent execution can push the market price above book value. Asian Paints is a good example. It often trades at a higher P/B because the market values its brand reputation, supply network, and track record of steady performance.
At the same time, a high P/B can also signal that a stock is overvalued. For instance, if a company’s growth slows or its peers trade at much lower multiples for similar performance, the market may have priced in expectations that are too high. Companies like some high-flying tech firms have seen elevated P/B ratios that eventually corrected when growth didn’t meet expectations.
The key is not to assume that a high P/B is automatically good or bad. To judge whether a stock is truly overvalued, it’s important to compare it with peers, industry norms, and other metrics like return on equity, earnings consistency, and capital efficiency. This balanced view helps you see whether the premium is justified or simply hype.
Read more about such multibagger stocks in our article Top Multibagger Stocks of the Last 10 Years – What We Can Learn
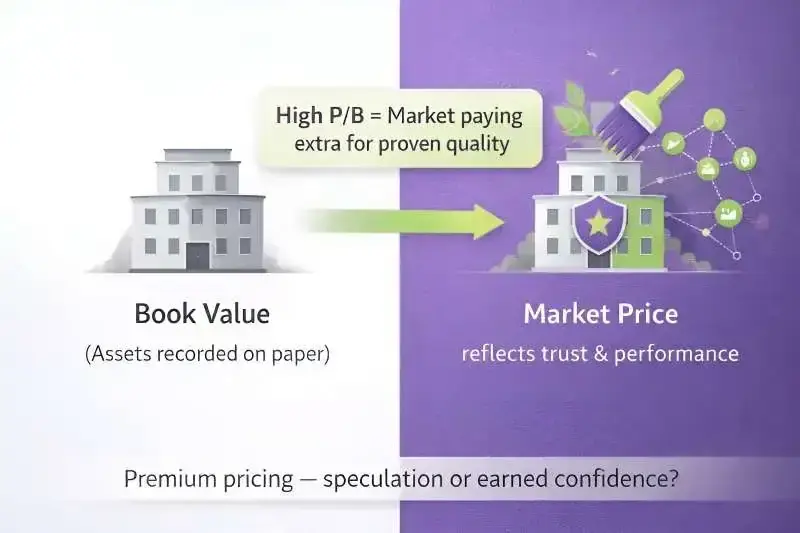
This naturally leads to a question: Is the higher price just hype, or is it the market recognising a business that has proven itself over many years?
Using BVPS & P/B Thoughtfully
Book Value Per Share and Price to Book are helpful, but they are not shortcuts to decisions. They work best as the starting point of curiosity, not the end of analysis.
When you see a number, the real value lies in asking why. Why is the share priced this way compared to its recorded backing? What story might be sitting behind that gap?
To understand more, these ratios should be viewed alongside return on equity. It shows whether the company is actually using its capital well to generate profits.
Earnings consistency adds comfort or caution. Steady results over time suggest reliability, while uneven performance invites closer attention.
Capital discipline matters too. Watching how management spends, reinvests, or expands tells you whether resources are handled thoughtfully or casually.
Looking at all these together brings balance. Instead of relying on a single ratio, you begin to see the business from multiple angles. “Price is what you pay. Value is what you get.” – Warren Buffett
Read more about finding exceptional opportunities in our article Top Undervalued Stocks in India Based on PE, PB & ROE
Their purpose is not to instantly label a stock as cheap or expensive. They exist to guide deeper thinking and prevent rushed conclusions.
Used this way, BVPS and P/B become conversation starters with the balance sheet. They encourage observation, patience, and better questions before action.
Explore our Products
Research Framework

Emerging Titans
Combination of quantitative analysis, industry tailwinds, and management assessment - SPRINT investment philosophy

Tiny Titans
Heavy emphasis on scuttlebutt research, plant visits, and early on-ground signals
Conclusion
Many investors check valuation ratios, hoping they’ll provide a clear answer, but numbers alone don’t tell the full story. Without context, BVPS and Price to Book can either feel reassuring or confusing, and that often makes people rush to a judgment out of impulse instead of thinking carefully.
The real value lies in understanding what those figures are connecting - ownership, accounting records, and market perception. When seen this way, they stop being formulas and start becoming tools for observation.
If this guide helped you look at valuation differently, comment “VALUE” below. Like if the examples shifted your perspective, share this with someone learning equity analysis, and tell us which ratio you find most interesting.
Read more about investing in smaller Indian companies and what to look for in our article: Investing in Small Cap and Micro Cap Stocks in India
FAQs
Can a high P/B always mean the stock is expensive?
+Not necessarily. A high P/B can also reflect a business’s strong brand, consistent profits, or unique capabilities that the market values beyond just assets.
Does a low BVPS mean the stock is cheap?
+A low BVPS simply shows how much of the company’s net assets back each share. It may be cheap, or it may indicate that assets aren’t generating enough return.
How is PE different from P/B?
+Can P/B be negative?
+Yes, if a company has a negative book value due to accumulated losses or liabilities exceeding assets, the P/B ratio can be negative. That usually signals caution for investors.
Should I compare P/B of a bank with a tech company?
+It’s not ideal. Different sectors use assets differently. Banks rely on capital and balance sheets, while tech companies often create value through intangible assets like code, brand, or network effects.

High growth stock specialist, Value Educator
Shashank Mahajan is an equity research professional with over 12 years of experience in identifying high-potential SME and micro-cap stocks at an early stage. He follows a rigorous scuttlebutt research–driven approach, combining on-ground insights with deep financial analysis. Shashank specializes in uncovering under-researched and under-owned companies with strong management quality and long-term growth potential. Through disciplined research and early identification, he focuses on spotting tomorrow’s market leaders before they enter the mainstream investor radar.

Glenmark: The USD 700 Mn Cancer Deal and Its Brands

Pharma Stocks in India 2026: Generics, APIs and CDMOs

Granules India: From Paracetamol to a 65% Gross Margin

Natco Pharma: After Revlimid, 29 Patent Challenges

Shilpa Medicare: Cancer APIs, Films and Biosimilars

Alembic Pharma: US Plants Pay Back, Margin Hits 22.2%
Explore our Products
Research Framework
Emerging Titans
Combination of quantitative analysis, industry tailwinds, and management assessment - SPRINT investment philosophy
Tiny Titans
Heavy emphasis on scuttlebutt research, plant visits, and early on-ground signals



India's Aerospace Opportunity
Global Demand. Supply Bottlenecks. Opportunities Ahead.
Don't Miss This Exclusive Webinar!
Join Value Educator to decode the key trends shaping India's aerospace sector and learn how to identify tomorrow's potential leaders in the space.
- How the aircraft value chain works, layer by layer
- Indian companies supplying global aircraft makers
- A framework to judge any aerospace company

 Orders
 Subscription
 Share with friends


Required Details
₹23999.00
(12 month subscription)
As per SEBI regulations, all users are mandated to complete the KYC that is validated for 1 year. Post payment, you will be redirected to the KYC screen


No comments yet. Be the first to comment!