
Technical vs Fundamental Analysis

Some investors remember Reliance Industries Limited as the stock that made them rich. Others remember it as the stock that made them quit.
Same company. Same years. Different outcomes — because some watched the weather, while others understood the climate.
Reliance saw many storms: sharp rallies, sudden falls, long dull phases. Investors who reacted to every move experienced chaos. Those who focused on the climate — including business growth, new engines of earnings, and valuation — stayed invested and allowed compounding to work.
This is the core mistake most investors make. They confuse short-term weather (charts, signals, daily moves) with long-term climate (business quality and earnings power). When that happens, investing feels like a gamble, not a system.
The cycle repeats endlessly: buy when the weather looks good, panic when a storm hits, and re-enter after prices rise. Years pass, activity stays high, but wealth barely grows. As Charlie Munger said, “Activity is the enemy of investment returns.”

Charts are weather reports – useful but fleeting. Fundamentals and valuation are the climate – they decide outcomes.
This article explores a simple but often misunderstood idea:
- Why short-term price signals feel powerful but fade quickly?
- How business quality and valuation quietly shape long-term outcomes?
- Why even great companies can disappoint at the wrong price?
- And how a clear, disciplined framework turns investing into a system?
Technical Analysis vs Fundamental Analysis — Two Tools, Two Very Different Jobs
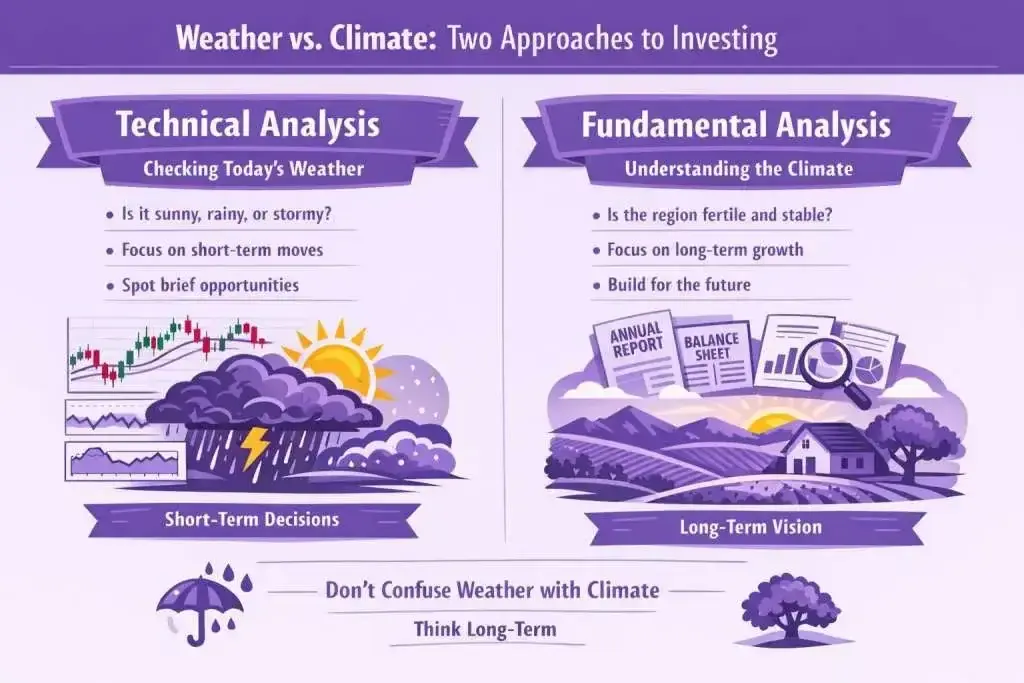
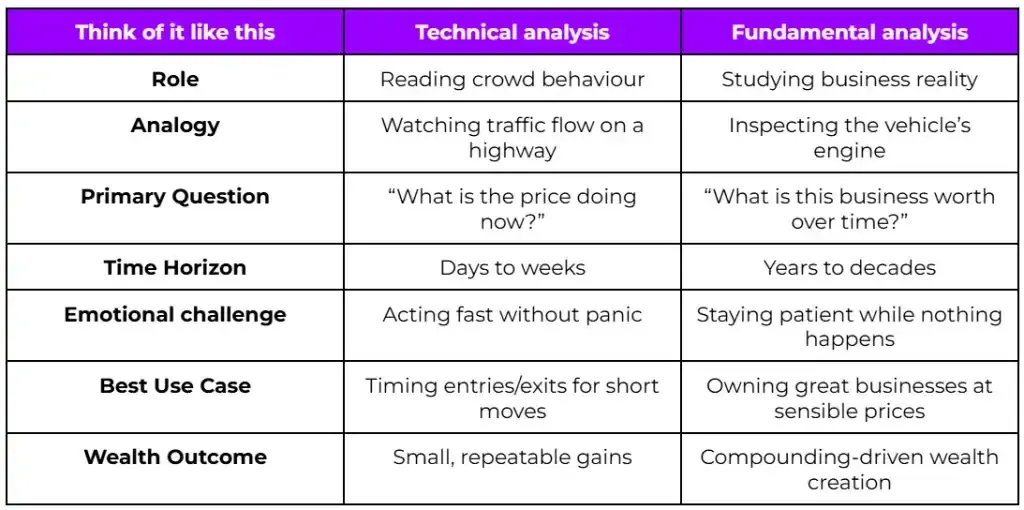
This is where the real difference becomes obvious. Technical analysis is like checking today’s weather. It tells you whether it’s raining, sunny, or stormy right now — useful if you’re deciding whether to carry an umbrella or take a short trip. It can help you avoid bad timing and spot brief opportunities, but it says nothing about what the place will be like over the next 10 or 20 years.Since technical analysis often triggers frequent decisions, emotional discipline becomes far more essential - especially during sharp market corrections.
Fundamental analysis is about understanding the climate. It tells you whether a region is generally fertile, stable, and capable of supporting long-term growth. That’s what matters when you’re deciding where to build your house and invest your future. Compounding only works when the underlying climate is right.
Most investors get into trouble when they confuse the two. They see a few cloudy days and assume the whole region has turned bad. Or they see a stretch of sunshine and believe it will last forever. They end up trading their houses based on daily weather reports.
As Warren Buffett has often said, investing isn’t a contest of intelligence — it’s a test of temperament. The investors who win are not the ones who react fastest to every storm, but the ones who choose the right climate and then stay put while time quietly does the work.
A More Human Way to See the Difference
Great companies are like great climates — stable, productive, and full of long-term potential. But even the best climate can have terrible weather. And if you enter during a heatwave, a flood, or a storm, your experience will be miserable even if the climate is perfect.
Charts show you the weather. Business quality shows you the climate.
What decides whether you get rewarded or punished is when you step in — and that is determined by valuation.
Valuation is the temperature at which you enter a great climate. Enter too hot, and even a wonderful business will disappoint. Enter when it’s cool, and compounding quietly works in your favour.
Valuation: Turning Fundamentals into Decisions
Valuation is the bridge that connects business analysis to actual investment outcomes. It tells you whether the price you see on the screen is cheap, fair, or expensive relative to the company’s earning power. As Seth Klarman has already said, “The single greatest edge an investor can have is a long-term orientation.”Consider a simple example. If a company earns ₹40 per share and trades at ₹800, it is trading at a P/E of 20. In very rough terms, you are paying 20 years’ worth of current earnings to own the stock. That may or may not be reasonable depending on how fast earnings can grow.
If earnings grow at 15% per year for ten years, ₹40 becomes roughly ₹160. If the market continues to value the business at a P/E of 20, the stock price could reach around ₹3,200. Buying at ₹800 would mean a fourfold return over a decade.
But if you paid a P/E of 60 because the chart looked exciting, you would have bought at ₹2,400. Even if the business performs exactly as expected, your return over the years would be disappointing, because valuation would likely normalise. Same business, same growth, very different outcome. To validate this point of ours,
Howard Marks has quoted - “Investment success doesn’t come from buying good things, but from buying things well.”
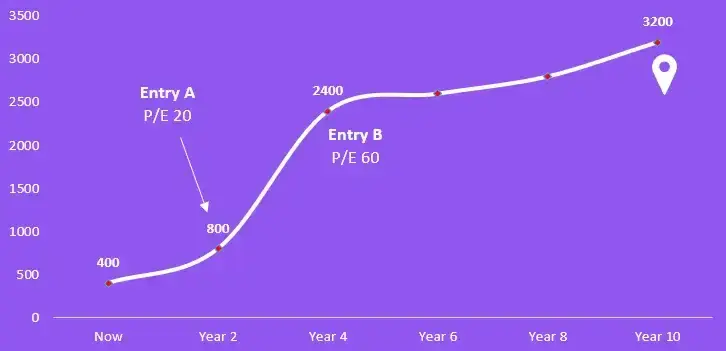
This is why valuation matters so deeply. It determines whether the business’s compounding works for you or against you.
What really separates winners from losers isn’t the stock — it’s the price paid and the patience shown.
That sounds abstract, so let’s ground it in using two familiar Indian examples.
Example 1: Infosys - When Great businesses don’t deliver, and when they do
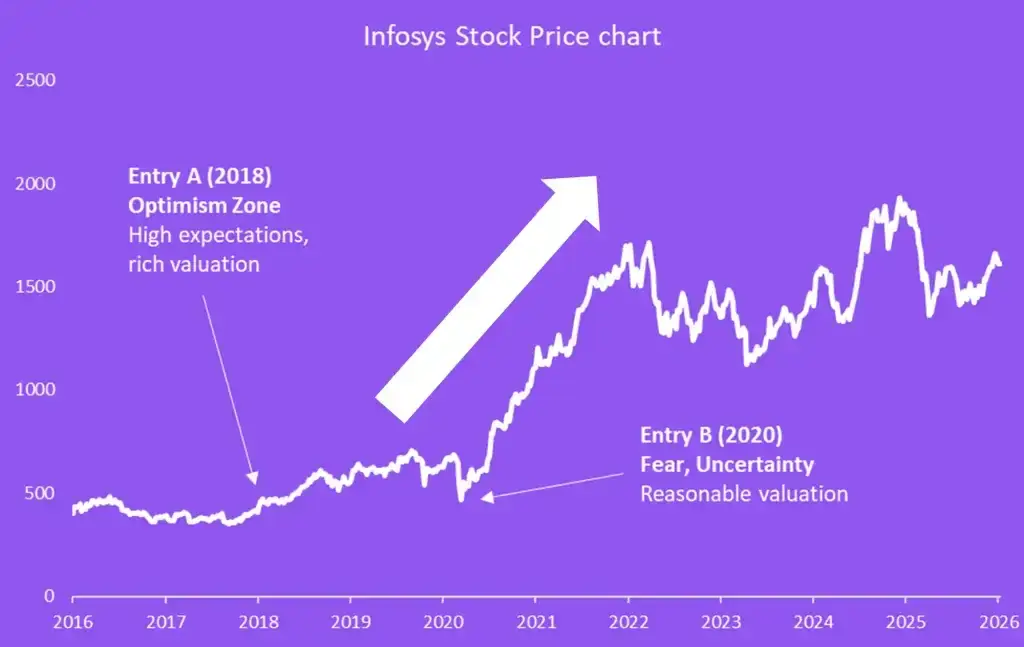
Infosys was a strong business throughout 2016–2020. Revenues grew. Profits grew. The balance sheet stayed clean. Yet many investors who bought around 2018 made little money for years — and some even lost money — because they paid high valuations when optimism was already baked in. The business performed, but expectations cooled. Earnings grew, but the stock didn’t.
When the same company was bought during the COVID panic of 2020 — at far more reasonable valuations — investors saw very different results. Nothing magical changed inside Infosys. The price did.
This illustration shows the stock’s price movement and highlights how valuations helped investors time their entry just before a sharp upward move:
Example 2: Titan Company — Patience, Multiple Compression, and When Quality Is Tested
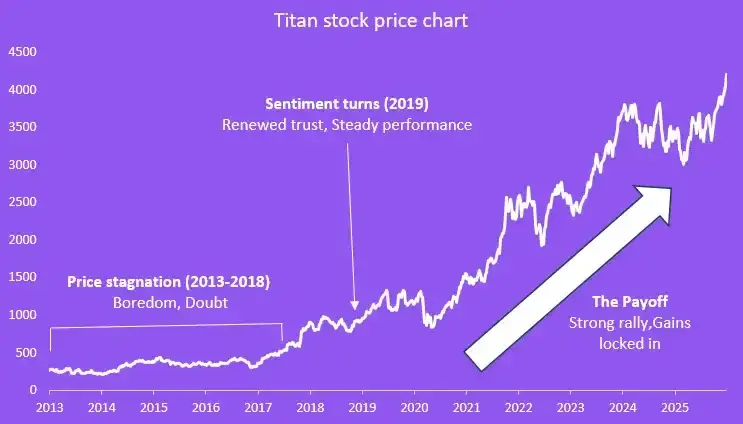
From 2013 to 2018, Titan made no progress. For five years, the stock remained flat while the business quietly continued to strengthen — expanding its brands, improving margins, and building scale. Most investors gave up because nothing seemed to be happening.
But once the valuation reset and confidence returned, the stock didn’t just move — it compounded for years. The people who stayed through boredom were the ones who earned the real money. The chart below shows what happens when you ignore the noise and give compounding the time it needs to work:
If you want to know more about how compounding actually works in the stock market, read our article on: The Power of Compound Interest: How to Create Wealth in the Stock Market.
Different companies. Same lesson.
A great business can be a terrible investment at the wrong price.
A great business can also feel like a mistake for years before it becomes a success.
Charts would not have saved you in either case.
They wouldn’t tell you that Infosys was overpriced in 2018.
They would neither tell you that Titan was quietly becoming stronger in 2015.
Only fundamentals + valuation could.
Takeaway: What These Two Stories Really Teach
These two stories expose the core truth behind technical vs fundamental analysis: Charts explain what the crowd is doing, whereas Fundamentals and valuation explain what the business is becoming.When you mix the two badly, you get the classic retail trap: buying expensive stocks because they look strong and selling great businesses because they look weak.
That’s why most investors stay busy but don’t compound.
Long-term wealth doesn’t come from predicting the next price move. It comes from owning strong businesses at sensible prices — and staying with them long enough for time to work.
That is why fundamentals and valuation must sit at the centre of any serious investing process — and why charts, at best, should only play a supporting role.
Charts in Long-Term Investing: Where They Mislead and Where They Help
Charts look clean, confident, and scientific — which makes them very tempting, especially for new investors. But when you’re making decisions meant to last 10 or 20 years, charts often do more harm than good if used as the main guide.The problem is false precision. Charts explain what prices did recently, not what will drive returns over the long run — business quality, earnings growth, and valuation. Prices react every second to news and emotion; fundamentals change slowly. Mixing the two leads to poor decisions. Charts also nudge investors into bad behavior. Strong uptrends can push people to overpay, while “sell signals” can make them exit great businesses too early.

That said, charts aren’t useless if kept in a supporting role. They can help you avoid rushing in after sharp price runs, understand the broad market mood, and manage staggered buying instead of investing all at once. Used this way, charts help with execution, not conviction.
The rule is simple: Charts show how the crowd feels today. Fundamentals and valuation decide what compounds over time.
The Boring Secret Behind Great Investing
When you study India’s most successful long-term investors, a simple pattern stands out. Their wealth was not built by spotting chart patterns or reacting to short-term price moves. It came from understanding businesses, buying them at sensible valuations, and then doing something most investors struggle with — waiting.Rakesh Jhunjhunwala made his biggest money by staying put. His Titan investment looked ordinary for years. The stock moved sideways, corrected often, and tested patience. Many investors exited. Jhunjhunwala stayed because the business kept improving and the valuation gave him time on his side.
Raamdeo Agrawal followed the same playbook. Stocks like HDFC Bank and Asian Paints were never about quick wins. They went through long, dull phases, but steady earnings and strong capital efficiency rewarded those who stayed invested.
Vijay Kedia took patience to the extreme. He entered Cera Sanitaryware early, at a sensible price, and held for nearly two decades. There was no constant trading — just time allowing compounding to fully play out.
What connects these stories isn’t genius stock picking.
It’s disciplined decisions — and then the ability to leave them alone.
All great investors end up following the same rules — even if they never write them down.
The problem for new investors isn’t a lack of intelligence or effort, but the absence of a clear structure. Without a framework, ideas remain scattered, decisions become emotional, and good intentions turn into inconsistent actions. What beginners need isn’t more information, but a simple, repeatable way to think and act.
That’s where a practical framework becomes essential.
Building a Simple, Practical Framework for New Indian Investors
Step 1: Understand the business, not the stock price:
Before numbers or charts, ask one simple question: What does this company actually do—and why will it still matter 10–20 years from now? If you can explain the business in two clear sentences, you’re on the right track. If you’re hiding behind buzzwords, pause and dig deeper. Investing isn’t about sounding smart; it’s about knowing what you own. This step alone avoids many bad decisions.
Step 2: Check financial health:
Once the business makes sense, see if it’s financially stable. Look for steady growth in revenue and profits, reasonable debt, decent ROE or ROCE, and profits backed by cash flows. You don’t need advanced accounting - patiently reading annual reports and basic financial data is enough.
Step 3: Judge valuation before timing:
A great business can still be a bad investment at the wrong price. Instead of asking if the chart looks strong, ask if the valuation makes sense. Compare current P/E with historical PE, peers' PE, and realistic growth. Paying too much assumes a perfect future - and that often hurts long-term returns.
Step 4: Decide how much to buy:
Good investing isn’t just about what you buy, but how much.
Keeping individual positions around 10–15% protects you from overconfidence and gives you room to learn and improve.
Step 5: Hold through volatility, track fundamentals:
Prices will move. Headlines will change. That’s normal. What matters is whether earnings, returns on capital, and business quality stay intact. Temporary discomfort is often part of long-term success.
Step 6: Sell using valuation and business reality:
Selling is hardest when things look great. But consider trimming or exiting if valuations become extreme, growth slows, or better opportunities appear. The real question isn’t where the stock goes next month—but whether the next 10–15 years still justify today’s price.
Bringing It All Together: Fundamental vs Technical - Which one should investors choose at the end?
The takeaway for long-term Indian investors is clear. Fundamentals and valuation should sit at the core of your investing process. They help you decide what to buy, when to buy, how much to allocate, and when it makes sense to exit. This quiet, disciplined reminder of this approach is what has created lasting wealth across generations.
Technical charts have a role—but a limited one. They can help with short-term trades, sentiment checks, or timing tweaks. They are not essential for long-term wealth creation. You don’t need complex indicators to build wealth over decades; you need patience, sensible valuations, and the ability to stay invested through volatility.
As history has shown again and again, enduring success comes from owning good businesses, buying them at reasonable prices, and holding them long enough for compounding to do its job. Charts reflect reality eventually — but fundamentals reveal it much earlier.
So what drives your investing today?
Comment “FUNDAMENTALS” if you invest in businesses for long-term wealth, or “CHARTS” if technical signals still guide most of your decisions.
Let’s see how investors here really think.
Explore our Products
Research Framework

Emerging Titans
Combination of quantitative analysis, industry tailwinds, and management assessment - SPRINT investment philosophy

Tiny Titans
Heavy emphasis on scuttlebutt research, plant visits, and early on-ground signals
FAQs ( Frequently Asked Questions )
Should a long-term investor completely ignore technical analysis?
+If technical analysis can’t build long-term wealth, why does it seem like so many people make money using charts?
+Charts can work in certain phases — especially strong bull markets and short trading cycles — where momentum rewards speed and activity, creating visible winners. What’s less visible are the hidden costs: small losses, overtrading, emotional fatigue, and long-term underperformance. As Charlie Munger warned, activity often feels productive while quietly hurting returns.
Over time, it isn’t chart patterns that drive wealth, but business performance, earnings growth, and valuation discipline.
Is fundamental analysis too complex for beginners?
+It doesn’t have to be. At its core, fundamental analysis asks three simple questions:
- Is this a good business?
- Can it grow meaningfully over time?
- Is the price reasonable today?
Why does valuation matter so much if the business is excellent?
+Can fundamentals and technicals be used together?
+Yes — if used in the right order.
- Fundamentals + valuation decide what to own.
- Charts can assist with how and when to execute.
Problems arise when charts override fundamentals — buying overvalued stocks because momentum looks strong, or selling great businesses because of short-term technical weakness.
What is the single biggest mistake beginners make?
+
High growth stock specialist, Value Educator
Shashank Mahajan is an equity research professional with over 12 years of experience in identifying high-potential SME and micro-cap stocks at an early stage. He follows a rigorous scuttlebutt research–driven approach, combining on-ground insights with deep financial analysis. Shashank specializes in uncovering under-researched and under-owned companies with strong management quality and long-term growth potential. Through disciplined research and early identification, he focuses on spotting tomorrow’s market leaders before they enter the mainstream investor radar.

Zen Technologies: Revenue Fell After a Big Win




PNG Jewellers: A 194-Year-Old Name Goes National

Explore our Products
Research Framework
Emerging Titans
Combination of quantitative analysis, industry tailwinds, and management assessment - SPRINT investment philosophy
Tiny Titans
Heavy emphasis on scuttlebutt research, plant visits, and early on-ground signals


 Orders
 Subscription
 Share with friends


Required Details
₹23999.00
(12 month subscription)
As per SEBI regulations, all users are mandated to complete the KYC that is validated for 1 year. Post payment, you will be redirected to the KYC screen


Well written. The core principles of value investing have been summarized really well