
Bid, Ask and How Stock Prices Move

When you open your trading app and see a stock price flashing on the screen, have you ever paused and asked who decided that number? Was it the exchange? The company? Some expert sitting behind a system approving it?
What if the answer is much simpler and far more fascinating?
What if that price exists only because, at that exact second, one person felt confident enough to buy and another felt comfortable enough to sell at the same level?
Every buyer is silently saying, this is what I think it is worth. Every seller is saying, this is the least I am willing to accept. When those beliefs overlap, even for a moment, a trade happens.
But here is the real question. If even one side changes its expectation slightly, if buyers become a little more optimistic or sellers slightly more impatient, would the price not shift instantly?
And if millions of such expectations are changing every second, what does that tell you about what a stock price really represents?

market. Each trade updates the picture of what participants collectively believe a stock is worth at that moment. The number you see is simply the most recent outcome of that ongoing discovery process.
Read more about different kinds of companies in our article: “What is Market Capitalisation? Understanding How the Market Values a Company”
At its core, this is supply and demand in its most practical form. When more people are eager to buy than sell, prices tend to edge higher. When selling pressure builds, prices move lower. It is not abstract theory. It is real people reacting to opportunity, risk, and uncertainty in real time.
As Benjamin Graham once put it, the market reflects opinion in the short run and true value over time. Looking at prices through this lens shifts the perspective. Instead of seeing a number on a screen, you begin to see the collective behavior and negotiation behind it.
The Bid Price — Buyer Intent and Demand
The bid price is the highest amount a buyer is willing to offer at this time. It is not a theoretical number. It is a real indication of demand backed by intent.
Think of it as the buyer’s voice in the market. When someone places a bid, they are essentially saying, This is the value I see in the stock at this moment. The stronger the demand, the more competitive these bids become. Multiple buyers may try to outbid each other, raising their offers to improve their chances of getting the shares. This competition creates upward pressure and contributes to price movement.
When bids start going up or move closer to the current price, it usually shows that buyers are more interested. People are ready to pay a little more, which can push the stock price higher.
If bids start falling or losing strength, it can show hesitation. Buyers may be unsure or less interested, which can keep the price from moving up.
Understanding this helps shift perspective. Instead of seeing price movement as a random fluctuation, you begin to recognise it as the outcome of competing intentions among buyers, each trying to secure value on their own terms. Let's understand this with the help of the most recent case of Kwality Walls.

To make this idea more tangible, consider a situation where the bid price for shares of Kwality Wall’s is ₹29.34. This means the highest amount buyers in the market are currently willing to pay for a share at that moment is ₹29.34. It reflects real demand, not an estimate or opinion. If multiple buyers want the stock, they may start offering slightly higher bids to improve their chances of securing it, pushing the demand signal upward. If interest weakens, bids may fall, showing caution or reduced enthusiasm.
If you want to know more about the share price dynamics, then read our article on: BVPS & Price to Book (P/B) Ratio: Identifying Asset-Based Value
The Ask Price — Seller Expectations and Supply
As you know, the bid shows what buyers are willing to pay, and the ask shows the lowest price a shareholder is ready to sell their share for. It actually reflects what the seller thinks the stock is worth and whether they are in a hurry to sell or can wait.
When many people are willing to sell, ask prices tend to be automatically lower. This shows there is plenty of supply.
If sellers think the stock is worth more, they demand/wait for higher prices. This makes supply tighter, and buyers may have to offer more money to get a deal.
Watching how ask prices move can show how confident or cautious people are feeling in the market.
To put this into perspective, consider shares of Coal India, where the current ask price stands at ₹415.4. This indicates that the shareholder offering those shares is not willing to sell for anything below ₹415.4 at that moment. For a transaction to occur, a buyer must agree to meet that level. Until then, it remains an expression of seller expectation rather than an executed trade.

As often attributed to Benjamin Graham, the market continuously reflects the attitudes of its participants, and the ask price is where seller conviction becomes visible in real time.
The Bid–Ask Spread — Market Friction and Cost
When you look at the bid and ask together, you can see a gap between them. This is called the bid–ask spread. It’s just the difference between what buyers are willing to pay and what sellers want at that moment.
Even if the gap looks small, it still matters. It shows the small friction in trading and is basically the cost of buying or selling a stock right away.
The spread is there because buyers and sellers rarely agree perfectly. Buyers want to pay less, sellers want more, and things like how busy the market is, uncertainty, and how many people are trading, all decide how big the gap becomes.

When the market is busy and things are steady, the gap between what buyers want to pay and what sellers want is usually small. Trades happen easily.
When the market is uncertain or when fewer people are trading, the gap gets bigger. Buyers and sellers become more careful, so it takes longer to make a trade.
Liquidity, in turn, also affects the spread. Stocks that trade frequently usually have narrow spreads because it is easier to match buyers and sellers. Less active stocks often have wider spreads, showing that it can be harder and slower to make a trade.
As John Bogle often emphasised through his philosophy on costs, small frictions in investing can compound over time. Understanding the bid–ask spread helps reveal one of those hidden frictions, encouraging more informed and thoughtful participation in the market.
Trade Execution and Price Formation
Once bids and asks are in place, the real action begins when a trade gets executed. This happens when a buyer and seller agree on a price, and the system matches their orders. It may feel invisible, but this matching process is what keeps the market moving every second.
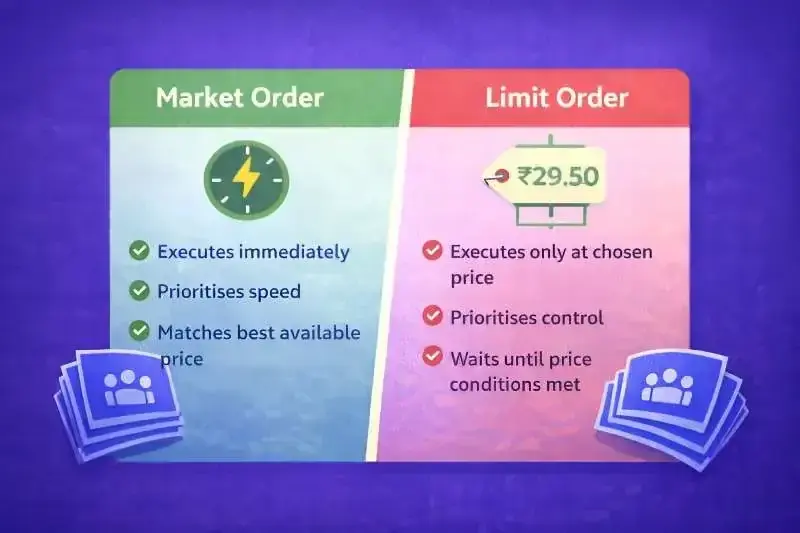
Not every order behaves the same way. A market order prioritises speed and executes immediately at the best available price. It suits participants who want certainty of execution rather than precision in pricing.
A limit order works differently. It allows investors to define the exact price they are comfortable with and wait for the market to reach it. In simple terms, their order won't get executed until their pre-specified price is met by any bidder. This approach reflects patience and control, especially useful when timing and valuation matter.
Each executed trade leaves a footprint. The latest transaction becomes the reference price shown on screens, influencing how others interpret value. In this way, price is continuously rebuilt through participation rather than fixed by authority.
Understanding this helps investors realise that prices are not abstract figures drifting randomly. They are outcomes of real decisions made under uncertainty, urgency, or conviction. Seeing execution this way adds depth to everyday trading observations.
As Jesse Livermore once observed, “The market is never wrong; opinions often are.” Remembering this keeps focus on actual transactions rather than assumptions, reinforcing the importance of understanding how execution shapes price.
When investors realise that their own orders can change the market, they start thinking more carefully before trading.
Placing a trade is more than just clicking a button. It is the moment when your plan turns into something that actually happens in the market.
Liquidity and Trading Efficiency
Liquidity sounds technical, but in simple terms, it answers one practical question - how easily can you buy or sell something without disturbing its price. In markets with good liquidity, trades happen smoothly and quietly, almost like water flowing through a wide pipe.
A stock that trades frequently usually has buyers and sellers waiting at most price levels. That means you don’t have to chase the market or settle for an uncomfortable price. As traders say, “Liquidity is comfort - it lets you enter and exit without friction.”
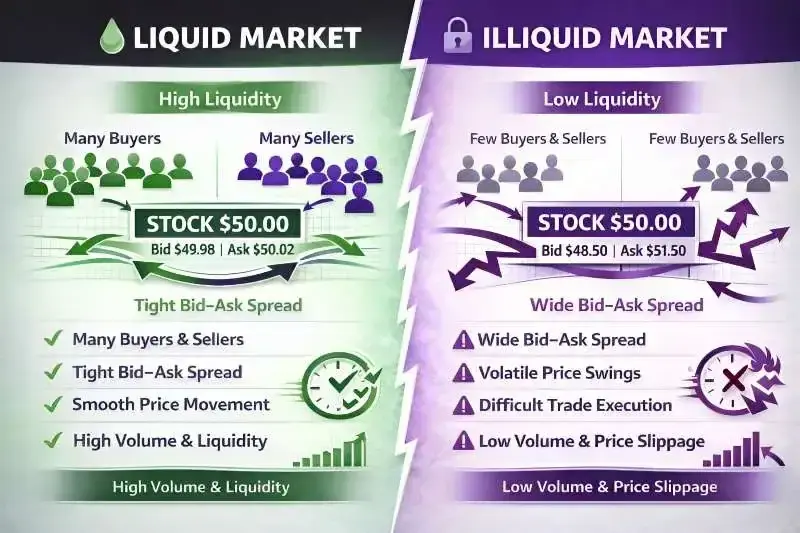
The presence or absence of liquidity shows up clearly in the bid–ask spread. Active stocks often display tight spreads, keeping trading costs low and execution predictable. When liquidity drops, spreads widen, and hidden costs creep in, even if the trade itself looks small.
Actively traded stocks - usually large, well-followed companies tend to offer efficiency because participation is broad and continuous. Information flows faster, price discovery happens quicker, and adjustments feel natural rather than abrupt.
Fewer liquid stocks tell a different story. Fewer participants mean hesitation, gaps between trades, and sometimes surprising price jumps. That environment demands patience, because “Illiquidity doesn’t just test your strategy, it tests your timing.”
Understanding this distinction helps you frame risk beyond charts and ratios. Liquidity influences costs, flexibility, and even psychological comfort when markets turn volatile. It’s not just about what you trade, but how easily you can step away from it.
If you want to know more about how you can rebalance your portfolio, then read our article on “Portfolio Rebalancing — Why and When You Should Adjust Your Allocation.”
In the end, trading efficiency isn’t only about picking the right opportunity. It’s also about choosing environments where execution supports your decision rather than complicates it. Liquidity quietly shapes outcomes, whether you notice it or not.
Investor Relevance and Practical Implications
Understanding how prices form is not just theory. It directly shapes how investors approach real trades. Being aware of bids, asks, and spreads helps you see the true cost of entering or exiting a position rather than focusing only on the headline price.
Trading awareness often reveals small frictions that quietly impact outcomes. Choosing between urgency and patience, or noticing when spreads widen, can prevent avoidable costs. As many experienced participants realise, “Execution decisions can matter as much as investment decisions.”
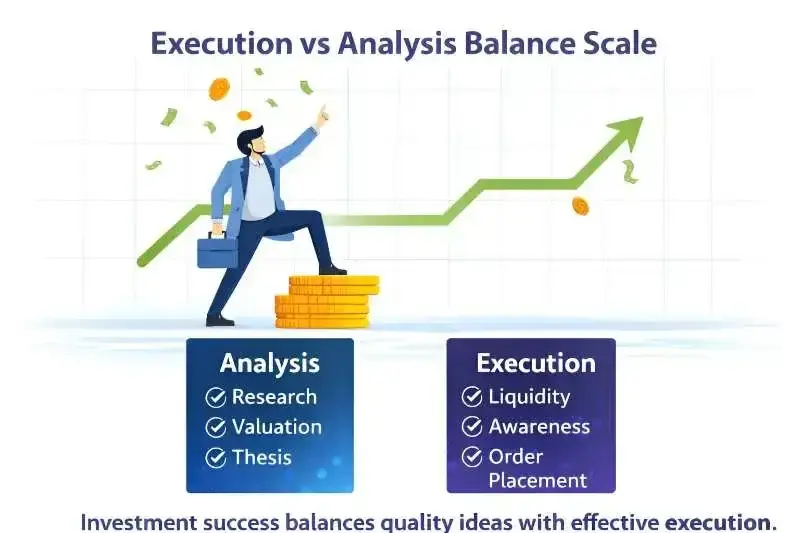
This awareness also sharpens decision-making. Investors begin to time entries more thoughtfully, place orders with intention, and avoid reacting impulsively to short-term movement. Clarity about market mechanics turns participation from guesswork into informed action.
Different investment styles view these dynamics through different lenses. Active traders may monitor spreads and liquidity constantly because execution efficiency directly affects performance. For them, microstructure awareness becomes part of daily discipline.
Long-term investors, however, may interact less frequently with the market. Even so, understanding order behaviour and liquidity still improves confidence during volatile periods. It reinforces patience and reduces the tendency to misinterpret price fluctuations.
If you are planning to create a balanced portfolio, then read our article on: Large Cap vs Mid Cap vs Small Cap — Structuring Your Portfolio Wisely
As Warren Buffett has often emphasised, “Risk comes from not knowing what you’re doing.” Gaining insight into trading mechanics reduces that uncertainty and builds a stronger foundation for decision-making.
Ultimately, investor relevance lies in perspective. Recognising how markets function beneath the surface encourages thoughtful participation rather than reactive behaviour. That shift does not guarantee returns, but it meaningfully improves the quality of engagement with the market.
Explore our Products
Research Framework

Emerging Titans
Combination of quantitative analysis, industry tailwinds, and management assessment - SPRINT investment philosophy

Tiny Titans
Heavy emphasis on scuttlebutt research, plant visits, and early on-ground signals
Conclusion
Stock prices are often viewed as fixed numbers that simply appear on a screen, but in reality, they are the outcome of constant negotiation. Every quote reflects a dynamic interaction between buyers expressing demand and sellers expressing supply. Understanding this shifts perspective - price is not assigned, it is discovered. It evolves continuously as orders enter, exit, and match within the marketplace.
Recognising the roles of bid, ask, and spread adds an important layer of awareness to investing. These elements reveal execution cost, liquidity conditions, and market sentiment beneath the surface of the last traded price. Investors who understand them are better positioned to enter thoughtfully, manage friction, and interpret market behaviour with clarity rather than impulse.
Read more about doubling returns in our article: The Rule of 72 — The Simple Math Behind Doubling Your Money
Market literacy is not built through prediction, but through understanding the process. The more familiar you become with how prices form and trades execute, the more confident and intentional your participation becomes.
If this article helped clarify how negotiation shapes stock prices, comment “PRICE DISCOVERY” below. Like if the visuals improved your understanding, share this with someone beginning their investing journey, and tell us, do you usually check the spread before placing an order?
FAQs
Why does the last traded price sometimes differ from the current bid or ask?
The last traded price is just the most recent deal that happened. The bid and ask show what buyers and sellers are currently willing to trade at. Between trades, people’s opinions and willingness can change, so quotes can move even if no new trade has happened.
Can observing order book depth provide useful insight before trading?
+Yes. Looking at how many buy and sell orders are waiting at different prices can give hints about where demand or supply is strong. It doesn’t predict the future, but it helps you see how easy or hard it might be to buy or sell.
How do large institutional trades affect spreads and price formation?
+Big trades can move prices or make the gap between bid and ask wider for a while. Large investors often split orders into smaller chunks so they don’t shake the market too much. How they execute shows that price moves are not just supply and demand.
Is trading in illiquid stocks always disadvantageous?
+Not always. Stocks that don’t trade often can still give opportunities, but you need patience and discipline. Wider spreads and slower trades mean you have to use limit orders and be willing to wait.
Does volatility automatically lead to wider spreads?
+Often, yes, but not always. When the market is uncertain, traders want extra compensation for risk, which can widen spreads. But very active stocks with lots of buyers and sellers can still have tight spreads even when prices jump around.

High growth stock specialist, Value Educator
Shashank Mahajan is an equity research professional with over 12 years of experience in identifying high-potential SME and micro-cap stocks at an early stage. He follows a rigorous scuttlebutt research–driven approach, combining on-ground insights with deep financial analysis. Shashank specializes in uncovering under-researched and under-owned companies with strong management quality and long-term growth potential. Through disciplined research and early identification, he focuses on spotting tomorrow’s market leaders before they enter the mainstream investor radar.

Zen Technologies: Revenue Fell After a Big Win




PNG Jewellers: A 194-Year-Old Name Goes National

Explore our Products
Research Framework
Emerging Titans
Combination of quantitative analysis, industry tailwinds, and management assessment - SPRINT investment philosophy
Tiny Titans
Heavy emphasis on scuttlebutt research, plant visits, and early on-ground signals


 Orders
 Subscription
 Share with friends


Required Details
₹23999.00
(12 month subscription)
As per SEBI regulations, all users are mandated to complete the KYC that is validated for 1 year. Post payment, you will be redirected to the KYC screen


No comments yet. Be the first to comment!