
Research a Stock in 1 Hour: A Checklist
People don’t lose money in the stock market because research is difficult — they lose money because their research is unstructured. Most investors read a news headline, look at the stock price, check the PE ratio… and assume they’ve “researched” a company. But real research isn’t about ratios first — it’s about understanding how the business actually earns money and whether that cash flow is dependable over time.

“Risk comes from not knowing what you’re doing.” — Warren Buffett
The goal of this 1-hour fundamental checklist is simple: in the first 60 minutes of research, you should be able to answer one honest question — Is this business worth digging deeper into, or should I step away? This guide is meant for beginners, retail investors, and junior equity analysts who want a structured, practical way to research a stock without complex models or jargon.
We’ll follow a simple top-down flow — what the business is, why it matters, and how to judge its strength in real life — using examples, behaviour insights, risk signals, and subtle red flags that most research articles ignore. The idea is to help you think like an analyst in the first hour — not just read numbers mechanically.
Before touching financial statements or ratios, real research begins with one simple step — start with the business, not the stock price.
Step 1 — Start With the Business, Not the Stock Price
In the first 5–7 minutes, your goal is to understand the business, not the valuation. Before looking at ratios or price charts, ask a very simple question: what problem does this company solve, and who pays them money for it? If you can’t explain that in one or two sentences, you don’t understand the business yet.
Try to identify whether the product or service is a necessity or a convenience, and whether the demand is recurring or one-time. Need-based and repeat-use businesses usually have steadier cash flows, while one-time order-driven businesses tend to be more volatile because revenues depend on timing rather than habit.
A simple example helps here. DMart doesn’t just sell groceries — it sells everyday affordability and reliability. Customers return repeatedly, not because of branding hype, but because the store solves a real, recurring need at a predictable price. That’s why its cash flows feel more “sticky” than many retail peers.

Now create a quick mental checklist:
- How does the company earn ₹1?
- Who is the real economic customer?
- What truly drives growth — new stores, capacity expansion, pricing, or macro cycles?
This is also where a subtle but powerful insight appears:
Revenue quality matters more than revenue growth. Growth driven by repeat customers or recurring demand is far more durable than growth coming from bulk orders or one-off contracts that may not repeat next year. One shows relationship strength — the other shows revenue noise.
Another useful lens here — if revenues are growing while employee costs are not rising at the same pace, it may indicate genuine operating leverage and business scaling efficiency. But if headcount or costs explode just to chase growth, the business may be stretching rather than strengthening.
The objective of Step 1 is simple — by the end of this stage, you should know what the business really does, who depends on it, and whether its growth is habit-driven or event-driven.
Once the business model feels clear, the next question is — how strong is its position within the industry, and can competitors easily replace it?
Step 2 — Industry Position & Moat
Once you understand what the business does, the next question is — how strong is its position inside the industry? A company doesn’t create value just by growing; it creates value when customers choose it over competitors for reasons that are hard to copy.
“The most important thing in evaluating a business is figuring out how big the moat is — and how long it can stay that way.” — Warren Buffett
At this stage, ask simple but powerful questions — why do customers choose this company? What makes them return? Can another player easily deliver the same product, at the same cost, with the same reliability? And more importantly, are its margins supported by genuine competitive capability, or are they simply benefiting from favourable market cycles?
A useful real-world lens — imagine a cables manufacturer showing strong growth because copper prices fell. Orders increased not because demand strengthened, but because customers advanced purchases during a cheaper commodity cycle. That is cyclical luck, not competitive strength — and such growth rarely sustains when the cycle reverses.

To judge whether a real moat exists, look for signals such as:
- high share of repeat customers
- long-term supply or service contracts
- switching cost or system integration lock-in
- strong distribution reach or geographic depth
- cost or capacity leadership versus peers
This is where a critical insight applies — if margins improve only when commodity prices fall, the business is benefiting from the environment, not from internal strength. A true moat shows up through margin stability across cycles, not through temporary spikes in good years.
Similarly, when you see a sudden margin jump, treat it as a question rather than a celebration. It may reflect genuine pricing power — or it may simply be the result of a one-off contract or abnormally large order. If margins sustain across periods, the advantage is structural. If they revert quickly, it was temporary luck.
By the end of this step, your goal is to understand whether the company earns money because it is better — or simply because the cycle is currently in its favour.
Once the competitive position feels clear, the next step is to zoom out and study the 5-year direction of financial trends — not ratios — to see how the business behaves over time.
Step 3 — 5-Year Financial Direction (not a ratios dump, but a trend story)
The objective of this step is not to calculate perfect ratios — it is to understand the direction and consistency of the business over the last 5 years. Spend 10–12 minutes simply scanning whether revenue looks stable or jumpy, whether profits are predictable or volatile, whether margins move like a smooth curve or a roller-coaster, and whether debt has quietly crept up in the background.
“Cash is a fact, profit is an opinion.” — Alfred Rappaport

A useful way to think about this is to ask — does the business behave like a steady operating engine, or like a trading opportunity? There have been many phases in market history where companies looked strong during upcycles — revenues and profits grew — but the balance sheet weakened because debt rose faster than cash generation. The story looked like growth, but the numbers told a very different truth.
A powerful mental model here is cash-flow grounding. If profits rise but cash flows stay negative year after year, it’s like earning a salary on paper but never having money in your bank account. In several historical cases, companies reported accounting profits — yet operating cash flow lagged because earnings were stuck in receivables or inventory rather than actual cash. That’s why analysts say: profit growth without cash flow is often an accounting illusion, not economic strength.
Another behavioural cue appears when receivables rise faster than revenue. This has often been seen in EPC and infrastructure businesses, where growth comes from project billing — but collections are delayed because payments are stuck with counterparties. In such cases, growth is not customer confidence — it is credit risk disguised as sales.
Similarly, when PAT looks healthy but working capital moves sharply negative, it signals hidden stress — the company may be funding growth through delayed supplier payments or extended customer credit. Inventory trends also speak loudly — when inventory rises faster than sales, it often reflects demand slowdown, channel stuffing, or over-optimistic production planning. At this stage, numbers are no longer financial metrics — they are behaviour signals.
The goal here is to read financials like a narrative:
- Is revenue growing because the business is strong — or because credit terms stretched?
- Are profits translating into cash — or trapped as promises on paper?
- Is debt funding expansion — or silently funding survival?
If Step 1 explained how the business earns money, and Step 2 showed how competitively strong it is, then Step 3 reveals whether the numbers behave honestly with the story the company tells.
Once the financial direction and earnings quality feel clearer, the next layer is to study how management allocates capital — and whether growth is driven by discipline or aggression.
Step 4 — Management Behaviour & Capital Allocation
This is the stage where professionals usually separate good companies from risky ones — not by looking at ratios, but by observing how management behaves when capital is at stake. The real signal is not in commentary or presentations, but in decisions around debt, dilution, expansion, diversification, and payout discipline.
A simple way to judge management intent is to ask — do they create value patiently, or chase size aggressively? For example, there have been periods in companies like Yes Bank where growth looked extraordinary on the surface — but expansion was driven largely by leverage and aggressive capital decisions. Profits grew fast, but the balance sheet weakened faster. When a company doubles its profit but also doubles its debt to fund expansion, the reality is that risk doubles along with growth.
Well-run management usually begins expansion after demand visibility improves, not before. Businesses like Asian Paints or HDFC Bank (over long cycles) are often cited because their expansion is phased, measured, and linked to utilisation — not to ambition alone. Their focus tends to remain on ROCE, consistency, and operating discipline, rather than chasing headline PAT growth. Promoter actions matter too — gradual stake increases and conservative guidance often signal alignment and maturity.
On the other side, weak capital behaviour shows up through
- Frequent equity dilution
- Promoter pledging
- Unrelated diversification moves
- Over-optimistic growth promises.
Many smaller companies and mid-caps have fallen into this trap — announcing large capex funded purely through debt, or chasing hot themes just to look exciting to investors. Growth appears impressive in the short term, but structurally becomes fragile expansion.
A key insight here — when capex is funded entirely through debt, the business becomes highly sensitive to cycles, interest costs, and cash-flow stress. Another subtle red flag appears when IPO proceeds are primarily used to repay old loans instead of funding genuine growth. In such cases, the company is not scaling — it is repairing the balance sheet, even though the narrative may sound expansion-driven.
Ultimately, management quality is less about storytelling and more about how capital is treated when growth opportunities appear. Disciplined capital allocation compounds quietly. Aggressive capital allocation shines brightly — until the cycle turns.
In the long run, management character matters more than valuation — because character decides how the business survives when conditions change.
Once management intent and capital allocation discipline are clearer, the next step is to understand the risk profile of the business — where it is exposed, and what could disrupt its growth engine.
Step 5 — Risk Checklist (Most Investors Skip This)
Real research is not just about identifying upside — it is about understanding what can break the business if conditions turn. A company may look strong in growth years, but its true nature appears when the cycle slows down. So at this stage, ask a very simple but powerful question:
What must NOT go wrong for this business to survive?
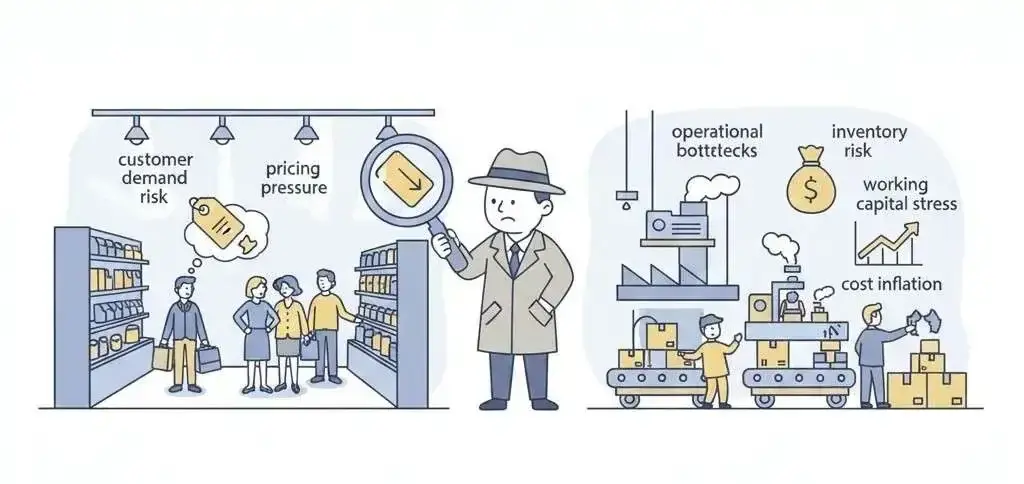
Instead of only looking at growth numbers, check how dependent the business is on a few key factors — a single customer, one geography, one product line, or a specific commodity cycle. Companies that appear stable during expansion years can turn fragile if even one of these pillars weakens.
A classic risk is in project-driven or industrial businesses. For example, a machinery manufacturer may show strong growth, but if 80–90% of its orders come from just a handful of large clients, one cancelled project can wipe out profits. That isn’t sustainable growth — it’s concentration risk.
During your quick review, scan for red flags like:
- Very high customer or sector concentration
- Earnings are tied closely to volatile commodity or macro cycles
- Forex exposure without a natural hedge
- Revenue is heavily dependent on government spending
- Working-capital stretch with rising receivables
The more concentrated the dependency, the more fragile the business becomes.
This is where a subtle but crucial insight applies — when a company shows high ROE along with very high working-capital requirements, the business often looks attractive in good cycles but becomes fragile when demand cools down. Returns appear strong because credit is stretched, not because economics are superior. The model works beautifully in tailwinds — and breaks painfully in downturns.
The purpose of this step is not to eliminate risk — every business has some — but to understand whether earnings are durable or just dependent on favourable conditions continuing forever.
Once risks and dependencies are clear, the final lens is to separate business reality from market narrative — and see whether returns are driven by fundamentals or by stories.
Step 6 — Market Narrative vs Business Reality
This step is where investing shifts from numbers to psychology. A stock can start looking exciting not because the underlying business has actually changed, but because the story around it has changed.
So the key question here is simple: are returns being driven by real earnings — or by narrative? Markets often go through phases where themes become larger than fundamentals. We see periods where almost every company starts positioning itself as an “EV play, automation play, AI play, or green energy play.” Prices jump first because investors fall in love with the theme — while earnings either come much later, or in many cases, never catch up.
A classic example of this behaviour was seen during the Dot-Com boom in the late 1990s, when internet-related companies were valued at extremely high prices simply because they were part of the “new tech future.”
Many of these businesses had weak cash flows, limited revenues, and no proven profitability — yet their valuations surged because the market loved the story. Just like how some companies today are valued as “AI plays” or “EV plays” before their economics stabilise, back then, investors were not buying cash flows — they were buying beliefs. And when reality failed to match expectations, many of those stocks collapsed, not because the idea was bad, but because expectations had run far ahead of what the businesses could actually deliver.

That’s why a useful behavioural checklist here is to ask: are investors buying the company for its real cash flows, or for the future story being sold? Are expectations already so high that even decent results may disappoint? Is the market rewarding the theme — or genuine execution?
Many great businesses underperform temporarily simply because expectations get priced too far ahead of reality. And many average businesses look extraordinary for a short time only because the story sounds exciting — even though the economics remain unchanged.
This leads to the golden takeaway: overvaluation is not about how expensive a stock looks — it is about expectations the business cannot realistically meet. When the story sounds bigger than what the numbers actually show, it’s usually wiser to wait rather than get excited. And once the noise is separated from reality, the final step is to convert the entire 1-hour research into a practical decision — whether the business deserves deeper study, patient tracking, or a clear pass.
Step 7 — The 1-Hour Output (Decision Filter & Closing Lens)
At the end of your first 1 hour of research, the goal is not to predict returns — it is to arrive at a calm, structured conclusion. Instead of getting excited by growth or scared by volatility, place the stock into one of three simple buckets:
Study deeper — strong business foundation, clean numbers, disciplined management
Track from sidelines — interesting story, but risks or cyclicality need more clarity
Avoid — weak cash flows, fragile balance sheet, or story-driven valuations.
No excitement.
No FOMO.
Only clarity.
A sample decision line could look like:
“Good business, cyclical margins, rising receivables — worth tracking, not investment-ready yet.”
This converts research from intuition into actionable judgment.
If a stock passes this 1-hour checklist and you want to evaluate it for long-term compounding potential, explore — “The Multibagger Framework: A Step-by-Step Guide to Finding 10x Stocks.”
Most investors don’t lose money because they lack information — they lose it because their research has no structure. This 1-hour checklist is not meant to predict returns or find the next multibagger; it is designed to help you think like an analyst — calmly, logically, and business-first.
When you understand how a company makes money, how honestly its numbers behave across cycles, how management treats capital, and where the real risks lie, you automatically avoid fragile businesses that only look strong during good times.
Real wealth creation doesn’t come from speed, excitement, or chasing stories — it comes from discipline, patience, and the ability to say “no” to businesses where cash flows, balance sheets, or incentives don’t align with long-term compounding. This framework helps you reach one honest, powerful outcome after the first hour of research: Should I study this deeper — or should I step aside?
If this checklist helped you bring more structure and clarity to your stock research, comment “CHECKLIST” below.
Like the post, if you want more research-driven breakdowns, share it with investors who rely only on ratios or tips, and tell me — which step in this framework changed the way you look at a company?
Good investing isn’t about finding more ideas — it’s about filtering better, avoiding fragile businesses, and backing only those that earn the right to compound over time.
Explore our Products
Research Framework

Emerging Titans
Combination of quantitative analysis, industry tailwinds, and management assessment - SPRINT investment philosophy

Tiny Titans
Heavy emphasis on scuttlebutt research, plant visits, and early on-ground signals
FAQs ( Frequently Asked Questions )
How does Warren Buffett analyze stocks?
+How to quickly analyze a stock?
+What are the 5 key principles of fundamental analysis?
+Which approach is better — fundamental analysis or technical analysis?
+How long does it take to analyse one company?
+
High growth stock specialist, Value Educator
Shashank Mahajan is an equity research professional with over 12 years of experience in identifying high-potential SME and micro-cap stocks at an early stage. He follows a rigorous scuttlebutt research–driven approach, combining on-ground insights with deep financial analysis. Shashank specializes in uncovering under-researched and under-owned companies with strong management quality and long-term growth potential. Through disciplined research and early identification, he focuses on spotting tomorrow’s market leaders before they enter the mainstream investor radar.

Zen Technologies: Why Revenue Fell After Its Biggest Win

Data Patterns: India's Radar Designer and Its Waiting Orders

KSH International: The Wire Inside India's Transformers

Krishna Defence: The Steel Behind India's Warship Hulls

PNG Jewellers: A 194-Year-Old Name Goes National

Axiscades: From Services to Missile and Radar Electronics
Explore our Products
Research Framework
Emerging Titans
Combination of quantitative analysis, industry tailwinds, and management assessment - SPRINT investment philosophy
Tiny Titans
Heavy emphasis on scuttlebutt research, plant visits, and early on-ground signals


 Orders
 Subscription
 Share with friends
 Logout


Required Details
₹23999.00
(12 month subscription)
As per SEBI regulations, all users are mandated to complete the KYC that is validated for 1 year. Post payment, you will be redirected to the KYC screen


Very thorough, well written