
Operating vs Net Profit Margin Explained
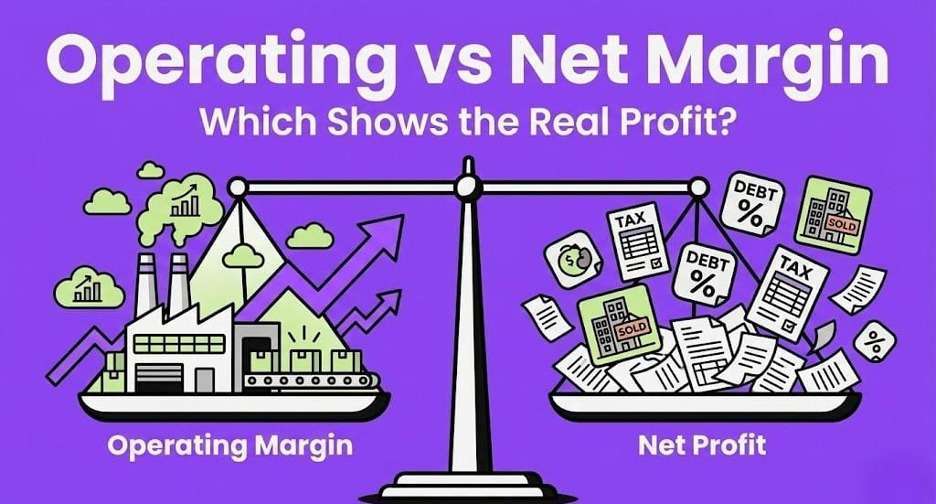
Why Profitable Companies Still Go Bankrupt — And The One Number That Warns You First
The Company That Reported Record Profits and Collapsed 6 Months Later
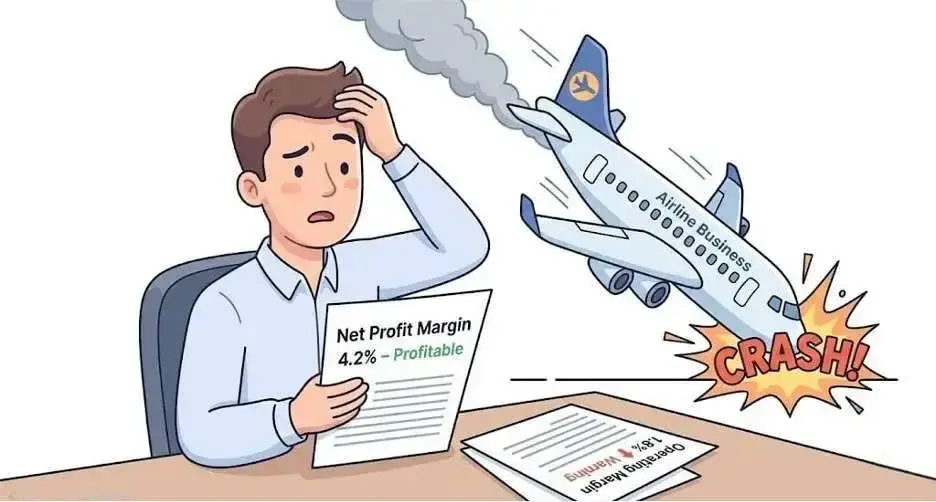
August 2018. Jet Airways reported its quarterly results. Revenue was up. Net profit margin looked healthy at 4.2%. Analysts were optimistic, but cautiously so. The stock held steady. In April 2019, six months later, Jet Airways suspended all flights. The airline was bankrupt. Lenders took over. Shareholders lost everything.
This is the conversation that should have happened in August 2018, but didn’t. While everyone focused on net profit margin, the operating profit margin was screaming warnings. It had collapsed to 1.8% from 8% just two years earlier. The core airline business — flying planes and filling seats — was bleeding. But nobody looked because net profit still showed black ink.
What most investors miss is that net profit can look healthy even when the actual business is dying. How? Through one-time asset sales, tax credits, subsidiary profits, or accounting adjustments. You sell a building, book ₹50 crore gain, and suddenly your dying business shows ₹30 crore net profit for the quarter. The profit is real. But it’s not repeatable. It’s not from operations. It’s financial engineering masking operational failure. This is where operating profit margin becomes critical. It ignores all the noise — no tax benefits, no asset sales, no one-time gains. It shows you one thing only: is the core business making money or not? Can this company sell its products or services at a margin that covers its operating costs consistently, or is it relying on financial tricks to stay afloat?
If you’ve ever owned a stock that reported profits quarter after quarter and then suddenly defaulted on debt, this article will show you what you missed.
You’re about to understand how this actually works — why some companies with good margins fail, while others with weaker margins survive, and why others with poor margins succeed. And whenever you may have counted on net profit margin as a sole measure of business, you will never do so again. It is not the memorizing of formulas. It’s about understanding which number reveals the truth about a business model and which number can be manipulated to hide problems until it’s too late. Because in the end, sustainable businesses are built on operating excellence, not accounting magic.
Net profit margin tells you what’s left after everything. Operating profit margin tells you if the business actually works.
1. What Operating Profit Margin Actually Measures (And Why It Matters More)
The Number That Can’t Be Faked
Operating profit margin is calculated by dividing operating profit by revenue. Operating profit is the revenue minus the cost of goods sold, less operating expenses. No interest, no taxes, no special items, no subsidiary business, nothing but the plain business. In the case of a restaurant, operating profit margin will give you an idea of whether you can sell food at the rates you set and be able to cover the cost of food, salaries paid to chefs, rent, and utilities. When you own a software company, it can tell you how your subscription income is compensating your development expenses, the salary of your sales team, and the cloud servers.This is the purest business model viability measure. When the operating profit margin is high and is constant, with no fluctuations in the economy, it does indicate that the firm has price power, control over costs, and that its business model is functioning well. The operating profit margin is negative or is falling, a company with a broken business model, no matter what the net profit may indicate.
To understand where operating profit and net profit appear in financial statements, read: How to Read a Profit & Loss Statement (P&L) in 10 Minutes
The beauty of operating profit margin is that it’s incredibly hard to manipulate for more than a quarter or two. You can’t sell buildings every quarter to boost it. You can’t use tax credits to inflate it. You can’t rely on subsidiary profits or forex gains. Operating profit comes from doing what your business is supposed to do — making products or delivering services at a profit. If that core activity doesn’t generate positive operating profit consistently, the business is in trouble. Everything else is just buying time.
Real-world example makes this crystal clear. Consider two companies, both showing 5% net profit margin. Company A has an operating profit margin of 12%, but it has to pay high interest rates on debts, which reduces its net profit to 5%. Company B has a 3% operating profit margin with one time gain on the sale of real estate, increasing the net profit by 5%. The net profit margin of both is equal. But Company A has a good business that is paying for historic errors in the form of debt.
If you want to understand how profits connect with assets, liabilities, and capital structure, read: How to Read a Balance Sheet Like a Professional Investor
Company B has a weak business, masking problems with asset sales. Within two years, Company A will likely improve as debt gets paid down. Company B will likely collapse once it runs out of assets to sell.
Operating profit margin also reveals competitive dynamics that net profit hides. If your operating margin is shrinking year after year, it means one of three things. First, competitors are forcing you to cut prices to maintain market share.
Second, your input costs are rising faster than your ability to pass them on to customers.
Third, your operating efficiency is deteriorating, and costs are spiraling.
All three scenarios are death sentences for a business model. The company might show net profit for a while through financial engineering, but the core business is dying. Amazon’s history shows the power of operating margin over net profit. For years, Amazon showed minimal or negative net profit margins because Jeff Bezos reinvested everything into growth. Analysts who focused on net profit thought Amazon was struggling. But Amazon’s operating profit margin in its retail business was consistently positive and improving, proving the core business model worked. Bezos was choosing to reinvest operating profits into expansion rather than showing it as net profit. Investors who understood operating margin got rich. Those who focused on net profit missed the entire opportunity.
Operating profit margin is calculated as Operating Profit/ Revenue multiplied by 100 to give a percentage. Profit after operations = Revenue- Cost of Goods Sold- Operating Expenses. Salaries, rent, utilities, marketing, R & D cost, and depreciation are all operating expenses and would make the business operate daily.
What it does not include is also significant as it includes interest payments on debt, taxes, subsidiary income, sale of assets gains or losses, gains or losses on forex, and other one-time extraordinary items. This exclusion is intentional. The idea of operating profit margin is created to answer only one question:
Does your core business model make a profit?
In the event of no, then none of it is relevant. In the event of yes, then you can gauge the appropriateness of how the company is using its capital structure, tax planning, and other financial aspects.
“Price is what you pay. Value is what you get. And operating margin is what the business actually earns.”
— Benjamin Graham (adapted)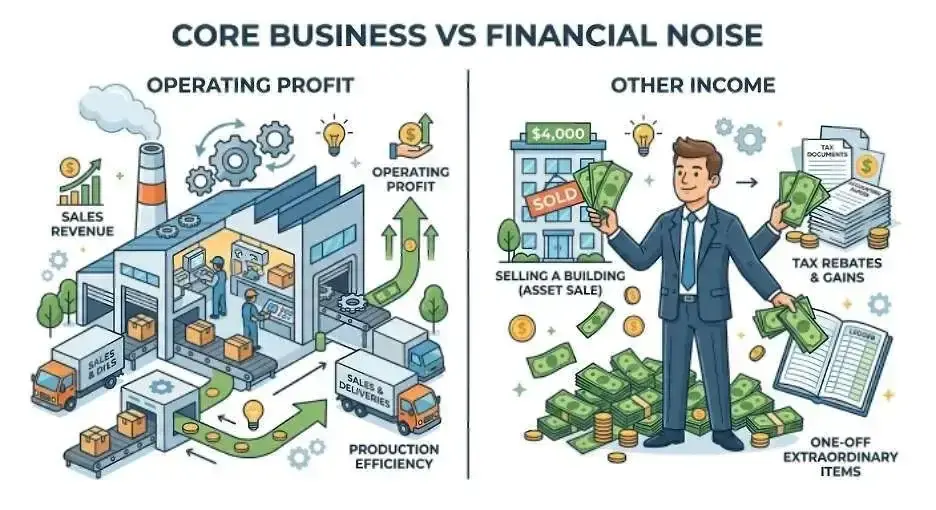
2. What Net Profit Margin Reveals (And Where It Misleads)
The Bottom Line Isn’t Always The Truth
The percentage of net profit margin is calculated as the net profit divided by revenue. The remaining amount after all deductions have been made is the net profit, i.e., the operating expenses, interest, taxes, one-time items, everything. This is the actual amount that flows to shareholders or gets retained in the business. For many investors, net profit margin is the only number that matters because it represents real money that could theoretically be paid out as dividends or reinvested for growth.But this focus on the bottom line creates a massive blind spot. Net profit margin can be manipulated, temporarily inflated, or distorted by non-operational factors. A company can have a strong net profit margin for a quarter or even a year while the underlying business is collapsing.
To see why profits don’t always translate into real cash, read: Understanding the Cash Flow Statement: Operating, Investing, Financing Activities
The most common way net profit misleads is through one-time gains that won’t repeat. A company sells a building and books a ₹100 crore gain. That flows straight to net profit. Suddenly, the company reports 8% net profit margin when its operating profit margin is only 3%. The market celebrates. The stock rallies. Investors buy in, thinking the business has turned around. But next quarter, there’s no building to sell. Net profit margin collapses back to 2% after accounting for interest and taxes.
Operating profit margin is still 3% — nothing has changed in the actual business. The investors who bought on the spike lose money. Another way net profit margin misleads is through tax optimization that isn’t sustainable. A company has accumulated losses from previous years. It uses those losses to offset current-year profits and pays zero tax. Net profit margin shoots up because there’s no tax deduction. Investors compare this company to competitors paying 25% tax and think it’s incredibly profitable. But once the accumulated losses run out, the tax bill arrives, and the net profit margin collapses. The business performance didn’t change. The tax structure changed.
Financial income from subsidiaries is another trap in net profit margin. A holding company owns profitable subsidiaries in different businesses. The parent company’s core business might be terrible with negative operating profit. But dividends from subsidiaries flow into the parent’s financial income, and after accounting for minimal corporate costs and taxes, the parent shows a decent net profit margin. Investors looking only at net profit think the parent company is well-run. But if those subsidiaries ever struggle, or if the parent needs to sell them to raise cash, the entire profit structure collapses.
The parent’s core business was never profitable — it was just collecting rent from subsidiaries. IL&FS is a perfect Indian example of net profit misleading investors, while operating profit warned of disaster. The infrastructure financing giant showed consistent net profit for years. Net profit margin looked acceptable on paper. But operating profit margin told a different story. The core business of lending for infrastructure projects was generating negative operating profit when you accounted for borrowing costs properly.
The company was borrowing short-term at 8-9% to lend long-term at 9-10%. The company was borrowing in the short term at 8-9 to lend in the long term at 9-10. The operating margin was very thin, and any strain in projects would result in it going negative.
Net profit was okay due to accounting estimates, restructuring profit, and one-time items. Once the projects began to fail in 2018, operating profits collapsed, and the entire structure fell apart. The reality could no longer be concealed by net profit.
Net profit margin is calculated as Net Profit/ Revenue, which is then multiplied by 100 to get a percentage. Net Profit = Operating Profit- Interest Expense- Taxes +/- Other Income and Expenses +/- Extraordinary Items.
It is the last figure at the end of it all. It contains the effect of the extent of debt that the company has (interest cost), the amount of tax that the company pays (can be huge depending on jurisdiction and tax planning), the extent to which the company has had a gain or loss in non-core operations (selling assets, forex, etc.), and whether there were any one-off events (restructuring cost, legal settlements, etc.).
All this is important to the comprehension of total profitability, but also exposes net profit margin to manipulation and short-term falsifications that conceal underlying business issues. All of this matters for understanding total profitability, but it also makes net profit margin vulnerable to manipulation and temporary distortions that hide underlying business problems.
“Earnings can be pliable as putty when a charlatan heads the company reporting them.”
— Warren Buffett
3. The Two Margins Together Tell the Complete Story
Reading Both Numbers Reveals What’s Really Happening
When you look at operating and net profit margins together, four patterns emerge. First scenario is both margins strong and stable — operating 15%+, net 10%+, holding steady over three years. This is the gold standard. The business model works, the capital structure is well-managed, no hidden problems. Asian Paints, Nestle, and TCS show this consistently. These are compounding machines.The second scenario is a strong operating margin (12-15%) but a weak net margin (3-5%). The gap is explained by high interest costs from debt. This is actually good if you understand what you’re buying. The business works — operating profit is strong. The company just has a debt problem from past expansion. As debt gets paid down, interest costs fall, and net margin rises toward operating margin. Patient investors buying at the right price make excellent returns. But verify debt is being paid down, not increasing.
To evaluate whether a company can actually handle its debt burden, read: What is Debt to Equity Ratio? Why it Matters for Small Cap Investing
The third scenario is the most dangerous. Operating margin is weak or declining (2-4%), but net margin looks acceptable (5-6%). The gap comes from one-time gains, subsidiary income, or tax benefits. This is Jet Airways pattern. The business model is broken. Operating profit can’t sustain operations. Management uses financial engineering to show bottom-line profits. Eventually, one-time sources dry up. Subsidiaries get sold or struggle. Tax benefits expire. Asset sales run out. Net profit collapses suddenly, and investors realize they own a business that never worked. Operating margin was screaming this for years.
The fourth scenario is both margins negative or barely positive. Obviously terrible — signals deep distress. Only acceptable for young startups deliberately burning cash to gain market share if there’s a clear path to positive operating margins within a defined timeframe. For mature businesses with consistently negative margins, it’s uninvestable. No revenue growth saves it. Eventually needs rescue funding, goes bankrupt, or gets sold for parts.
“In the business world, the rearview mirror is always clearer than the windshield.”
— Warren Buffett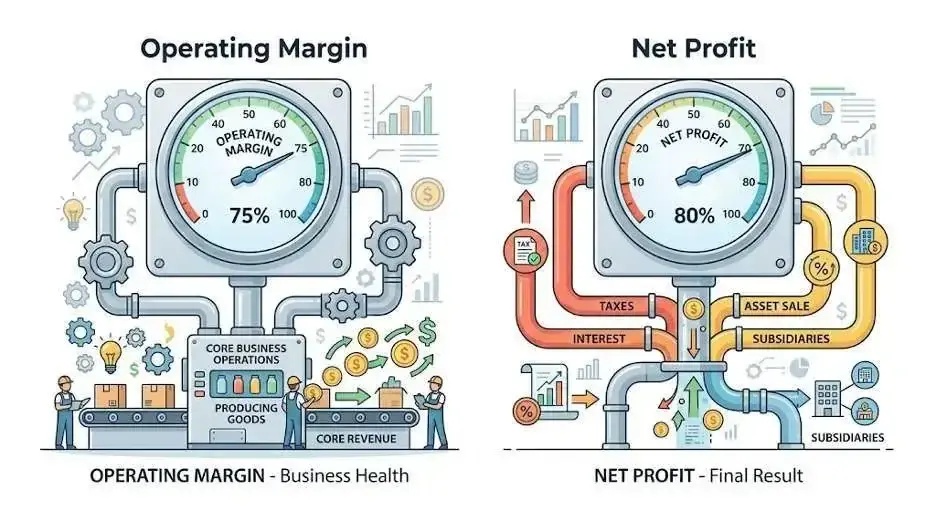
4. Industry Benchmarks: What’s Normal vs What’s Warning Signs
Different Businesses Have Different Margin Profiles
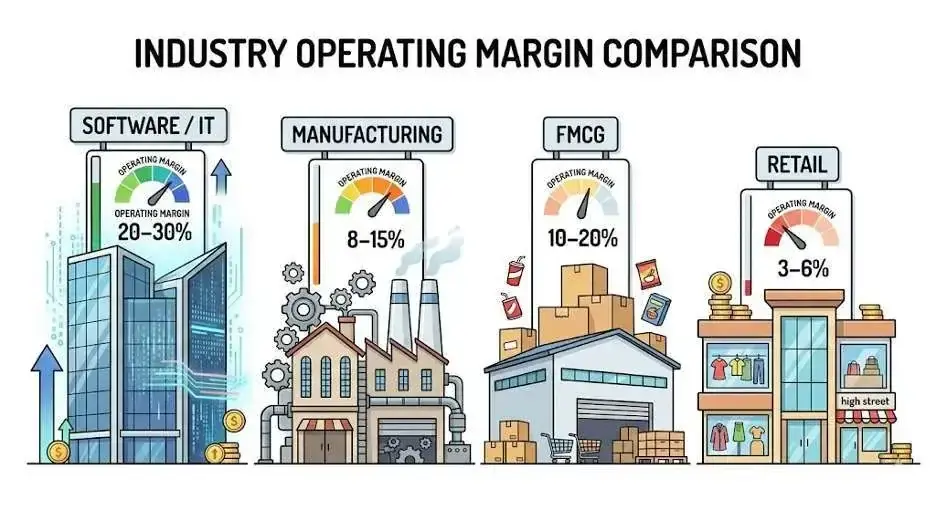
Among the greatest errors that investors commit is one that they compare margins in totally different industries without the knowledge of structural differences. A software firm having 5% operating margin is awful. A retail firm that has an operating margin of 5 percent is superb. Context matters enormously.The operating margin of software and IT services firms should not be lower than 20-30% in the case of established players, since after developing the software, the cost of serving the next customer is close to zero. Net profit margins should be 15-25%. TCS, Infosys, and Microsoft are always performing in these ranges. When a well-established software firm is operating with lower than 15 operating margins, then something is quite amiss.
The operating margins of FMCG and consumer goods companies are 15-25%, as well as their net profit margins, 10-15%. Such businesses possess strong brands that exert pricing power and experience commodity input costs and marketing expenditures. This zone has operations of HUL, Nestle, and Britannia. When an FMCG firm records a low operating margin, which is lower than 10, it is an indication that it is highly competitive or is managing its costs badly.
The retail and e-commerce sectors are structurally based on razor-thin margins. Normal operation margin is 3-6%. Net profit margins of 2-4% are acceptable. DMart achieves operating margins of 7-8%, which is exceptional in retail. If the operating margin is below 2% for extended periods, the business is vulnerable to any external shock.
Banking uses different metrics entirely. Net Interest Margin (NIM) of 3-4% is healthy. Return on Assets (RoA) of 1-1.5% is good. Return on Equity (RoE) of 15%+ is excellent. HDFC Bank and Kotak consistently deliver in these ranges. Manufacturing and capital-intensive industries like steel, cement, and auto have cyclical margins. During peak cycles, operating margins can hit 20-25%. During downturns, they can crash to 5% or negative. You must compare trends across the cycle, not point-in-time numbers. Consistency across cycles matters more than peak performance.
“The four most dangerous words in investing are: ‘This time it’s different.’”
— Sir John Templeton
5. Red Flags: When Margins Warn of Disaster
The Patterns That Precede Collapse
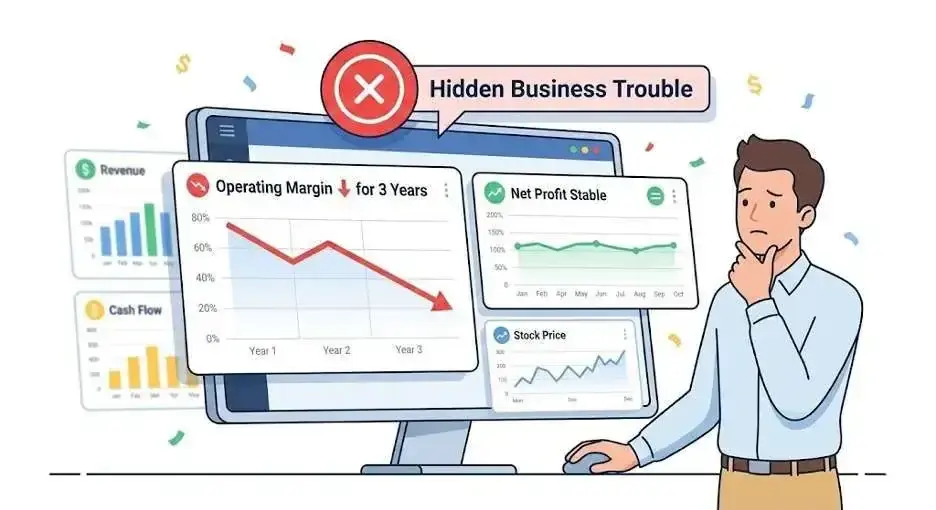
There are specific margin patterns that precede business failures with remarkable consistency, and learning to recognize them can save you from catastrophic losses. The first and most reliable red flag is an operating profit margin declining for three consecutive years while the net profit margin appears stable. This is the Jet Airways pattern. The core business is deteriorating—costs are rising faster than revenue and pricing power is weakening—but accounting adjustments temporarily keep reported profits looking healthy.A classic example occurred in 2008 when Jet Airways changed its depreciation policy on certain aircraft from the written-down value method to the straight-line method. This accounting change resulted in a one-time write-back of approximately ₹9,159 million, significantly boosting reported profits for the quarter even though the underlying operating performance remained weak.
Each quarter, they find something to keep net profit positive. Investors focused only on net profit don’t see the operating margin declining steadily until it’s too late. By the time the operating margin goes negative and cannot be hidden anymore, the company is already in terminal decline. If you see this pattern — operating margin down three years, net profit holding up — sell immediately. Don’t wait to understand why. The why doesn’t matter. The business is dying.
The second red flag is operating and net profit margin gap widening dramatically over 2-3 years. Initially, the operating margin was 10%, and the net profit margin was 7%. Now operating margin is 12%, but net profit is still 7%. What happened? Interest costs increased because the company is borrowing heavily to fund operations. This means the business can’t self-fund its working capital or growth despite improving operating margins. Or tax rates increased because tax credits expired. Or subsidiary income that was boosting net profit dried up.
All of these scenarios are dangerous. A business with improving operating margins should see improving net profit margins unless capital structure is deteriorating. If the gap between the two is widening, dig deeper into debt levels, working capital management, and cash flow from operations. Usually, you’ll find the company is borrowing to survive despite operating profit looking decent on paper.
The third red flag is an operating profit margin turning negative while revenue is still growing. Revenue up 20%, but operating margin is -3%. This is the classic growth-at-any-cost trap that destroys capital. The company is acquiring customers or market share by pricing products below cost. Every incremental sale loses money on an operating basis.
Management tells investors this is an investment phase, and margins will improve with scale. This can be effective sometimes, as Amazon pulled it off. However, it only works out disastrously 90 percent of the time. If the company does not reach the scale of positive operating margins, the competitors will match the low prices, and the company drains capital until it fails or is acquired at distressed prices. Vodafone Idea gained millions of subscribers between 2016 and 2019, whilst operating margins decreased to negative. Profitability was killed, and revenue increased. Any investor who had justified the growth story had lost all.
The fourth red flag is margins spiking dramatically for one quarter with no clear operational reason. Operating margin suddenly jumps to 14% in one quarter and falls back to 7% the next.
The volatility of net profit margin is the same. In the notes themselves, you have one-time gains, accounting adjustments, or reversals of provisions. Established businesses are stable and predictable in terms of margins. Unaccounted, sudden spikes in margin are rarely indications of any normal accounting practices or financial circumstances.
The management could be recognizing revenue prematurely, capitalizing costs that ought to be charged to expense, or reversing provisions that were made in the previous years to exaggerate the current profits.
None of this is sustainable. A business with genuine operating improvements shows steadily improving margins over multiple quarters, not sudden spikes and crashes. Whenever you see quarterly margin volatility above 3-4 percentage points without clear explanations in the MD&A section, assume the worst and avoid the stock.
“You only find out who is swimming naked when the tide goes out.”
— Warren Buffett
6. How to Use Margins for Better Investment Decisions
The Framework That Actually Works
When evaluating any company, follow a systematic approach. Start by pulling three years of annual statements and plotting both operating and net profit margin on a chart. You want to see trends, not point-in-time numbers. One bad quarter might be an aberration. Three consecutive quarters of declining operating margin is a pattern. Look at direction and consistency first. Are both margins rising, stable, or falling? Consistency signals predictable business economics and strong management. Volatility signals either cyclical dynamics or poor execution.Once you understand the trend, calculate the gap between operating and net profit margin for each period. The gap is supposed to be fairly constant unless capital structure is undergoing a planned transition. In case the operating margin is 15, the net profit is 11, the 4% difference ought to remain at approximately 4%.
When the operating margin remains at 15 percent, and the net profit decreases to 7 percent, the difference between the two has increased (by 4 percent) to 8 percent. Something changed — either debt increased (higher interest), tax rates changed, or financial income disappeared. Check the notes to understand what happened. Growth debt can be acceptable. Debt to fund operating losses is a death sentence.
Compare the company’s margins to industry peers and historical averages. If this company’s 12% operating margin lags competitors averaging 18%, investigate why. Is it a lower-margin segment? Lack of scale? Weaker business model? When a firm is steadily trailing competitors by 3-4 percent over the years, it is not likely to narrow the gap. In the same way, compare the existing margins with those in the history of the company.
When the operating margin was 20 percent three years ago, and it is 12 percent today, what has changed? Competition? Input costs? Entry into lower-margin business? Sometimes compression is strategic — Amazon deliberately compressed margins to invest in AWS. But often, it signals a deteriorating competitive position.
Margins tell part of the story, but overall profitability is best measured through returns on capital. Learn how here: How to Calculate Return on Equity (ROE) Step-by-Step
Pay attention to margin behavior during stress. How did margins hold up during the 2020 COVID pandemic? During the 2018 liquidity crisis? Businesses with pricing power maintain their margins even when revenue falls. The simplest businesses experience a faster fall in margins than revenue during downturns.
Finally, read management commentary about margin trends. Are they acknowledging pressure and explaining mitigation? Or ignoring declining margins while highlighting revenue growth? Management that openly discusses challenges is trustworthy. Management that avoids margin discussions is hiding problems.
“Risk comes from not knowing what you’re doing.”
— Warren Buffett
Explore our Products
Research Framework

Emerging Titans
Combination of quantitative analysis, industry tailwinds, and management assessment - SPRINT investment philosophy

Tiny Titans
Heavy emphasis on scuttlebutt research, plant visits, and early on-ground signals
Conclusion + Cta
Most investors pick stocks based on P/E ratios, revenue growth, or market momentum. All of that matters, but it’s built on quicksand if you don’t understand the two numbers that reveal whether the business actually works. Operating profit margin shows you if the core business generates profit consistently from its primary operations. Net profit margin shows you what’s left after all costs, taxes, and financial activities. The gap between the two tells you whether success comes from operational excellence or financial engineering.The biggest investing mistake isn’t buying companies with low margins. It’s buying companies with declining operating margins while net profit still looks acceptable. This pattern precedes business failures with remarkable consistency. Management hides deteriorating operations behind one-time gains, asset sales, and subsidiary income.
Net profit looks fine for quarters or even years. Then suddenly, the non-operating sources of profit dry up, operating losses become impossible to hide, and the company collapses. Shareholders who focused only on net profit lose everything. Those who watched the operating margin declining for eight quarters weren’t surprised. They sold long before the collapse.
Understanding margins isn’t about becoming an accountant. It’s about asking the right question before you invest: Does this business make money from its core operations consistently, or does it rely on financial tricks to show profits? If the answer is the former, you can invest with confidence even if net profit is temporarily suppressed by debt or taxes.
If the answer is the latter, you avoid disasters before they happen. Start looking at both margins together. Track trends over time. Compare to peers and history. Read management’s explanations. This simple discipline will save you from more losses than any other analytical tool.
Your portfolio should not be built on companies that report profits through accounting magic while the underlying business bleeds. It should compound wealth through businesses that generate operating profits consistently and reinvest them for growth. The difference between these two types of companies shows up first in operating margin trends, not net profit. Learn to read the warning signs, and you’ll avoid the disasters that wipe out investors who focus only on the bottom line.
👉If you found this read insightful, comment “MARGINS” below, and if you are curious about other stock market concepts, keep exploring more of these reads on our website
FAQs
Which margin should I focus on more — operating or net?
+Operating profit margin is the key to comprehending the quality of a business and its sustainability. The business model of a company that has good and robust operating margins is functional and capable of producing cash at any given time. Net profit margin is important to know about the total returns made to the shareholders and the efficiency with which the company uses its capital structure. However, among them, operating margin will tell you more about the fundamentals of a business. But the clever thing is to always look at the two simultaneously and know why they are different.
Can a company have a negative operating margin but a positive net profit margin?
+Yes — and it’s a massive red flag. in virtually all cases. This occurs when the operating basis of the core business of the company makes losses, but the financial gains on the subsidiaries, the selling of assets, or in other cases, a one-time gain make the net profit become positive. This is unsustainable. Sooner or later, these sources of profit that are not operating run out, and eventually the company collapses because the underlying business doesn’t work. The only exception is the holding companies that are merely there to get dividends as a result of operating subsidiaries. Even there, however, you want to examine the operating margins of the subsidiaries behind it to make sure the overall structure is good.
How do I calculate these margins myself?
+Operating profit margin = Operating Profit ÷ Revenue × 100. Operating Profit appears on the income statement (sometimes it is referred to as EBIT, Earnings Before Interest and Taxes). Division by Revenue and multiplication by 100 to obtain a percentage. Net profit margin = Net Profit/ Revenue x 100. The bottom line in the income statement is the Net Profit (also referred to as Profit After Tax or PAT). Divide by revenue and multiply by 100. These two calculations require a calculator or Excel, which takes 30 seconds with the financial statements of the company.
What’s a good operating margin for a startup losing money?
+For genuinely early-stage startups in capital-intensive or network-effect businesses, negative operating margins for 2-3 years can be acceptable IF there’s a clear path to positive margins with scale. You should see two things: first, gross margin should already be positive and expanding (revenue minus direct costs of delivery). If gross margin is negative, unit economics don’t work, and scale won’t save the business. Second, the operating margin must continue to get better annually, although it may still be negative. A move of -40% to -25% to -15% indicates improvement towards breakeven. In case the operating margin remains at -35 per cent in three years, even when revenue grows, the business model is flawed. Also, verify the company has enough capital to reach operating breakeven. If they run out of money before margins turn positive, they’ll need rescue financing at terrible terms or go bankrupt.
Should I avoid all companies with low net profit margins?
+No. Low net profit margins aren’t inherently bad if they result from a deliberate capital structure or industry characteristics. Retailers naturally have net margins of 2-4%, but they generate great returns through high inventory turnover. A company might have a low net margin because it carries strategic debt for tax efficiency, while its operating margin is strong. The key is understanding why the net margin is low. If it’s low because the operating margin is weak, avoid it. If it’s low because of temporary factors like high interest costs that will decline, or because the company operates in a low-margin-high-volume industry but executes well, it might be a great investment. Context always matters more than absolute numbers.
How often should I check margins?
+For stocks you own, check margins quarterly when results are released. Plot them on a trend chart so you can see patterns developing. If you notice the operating margin declining for two consecutive quarters, start asking why. If it declines for three consecutive quarters, seriously consider selling unless you have high conviction in a specific turnaround catalyst. For stocks you’re researching, pull at least three years of annual data to understand the trend before investing. One year of data isn’t enough to separate temporary factors from structural changes.

High growth stock specialist, Value Educator
Shashank Mahajan is an equity research professional with over 12 years of experience in identifying high-potential SME and micro-cap stocks at an early stage. He follows a rigorous scuttlebutt research–driven approach, combining on-ground insights with deep financial analysis. Shashank specializes in uncovering under-researched and under-owned companies with strong management quality and long-term growth potential. Through disciplined research and early identification, he focuses on spotting tomorrow’s market leaders before they enter the mainstream investor radar.

Zen Technologies: Revenue Fell After a Big Win




PNG Jewellers: A 194-Year-Old Name Goes National

Explore our Products
Research Framework
Emerging Titans
Combination of quantitative analysis, industry tailwinds, and management assessment - SPRINT investment philosophy
Tiny Titans
Heavy emphasis on scuttlebutt research, plant visits, and early on-ground signals


 Orders
 Subscription
 Share with friends


Required Details
₹23999.00
(12 month subscription)
As per SEBI regulations, all users are mandated to complete the KYC that is validated for 1 year. Post payment, you will be redirected to the KYC screen


No comments yet. Be the first to comment!