
Return on Equity (ROE) Explained

"I always think back to the image of a woodworker’s shop. There’s a huge difference between needing a room full of expensive power tools to get a job done and being the person who can craft a world-class violin with nothing but a couple of hand blades. One relies on the machine; the other relies on the soul of the craft."
In the world of finance, ROE is the metric that tells you which "craftsman" is truly the most efficient. It’s not just about how much profit a company makes; it’s about how effectively it uses the "tools" the shareholders' money to build that bottom line.
Think of it as a report card for management’s intuition and discipline. When you invest your hard-earned capital into a business, you aren't just looking for growth; you’re looking for a sign that the people at the helm know how to turn every dollar of your equity into something greater. ROE strips away the noise of company size and market hype, revealing the raw engine of profitability underneath.
In this guide, we’ll walk through the mechanics of this calculation, helping you peel back the layers of a financial statement to see if a company is truly thriving or just spinning its wheels.
Read More: 10 Stock Market Terms Every Beginner Must Know Before Investing.
What is Return on Equity?
Think of ROE as the ultimate "bang for your buck" metric. While profit tells you how much a company made, ROE tells you how good they are at using your money to make it.
If you’re an investor, this is the number that separates the companies that are actually building wealth from the ones that are just going through the motions.
The Basic Formula
(ROE) = (Net Income / Shareholder’s Equity)*100
Think of it like this: You and a couple of friends decide to go all in on a high-end lemonade stand. You pool your savings and drop 1,000 to get it rolling, buying a fancy pro-grade squeezer, building a sharp-looking stand, and stocking up on crates of lemons. That 1,000 is your Shareholders' Equity. Plain and simple, that’s your "skin in the game." It’s the cash you and your friends actually own in the business.
Fast-forward to the end of your first month. After you’ve paid for the sugar, the bags of ice, the lemons, and even kicked a little cash to the park for your permit, you sit down and count the drawer. You’ve got 150 of pure profit left over. That’s your Net Income.
Now, the real question pops up: "Was that 1,000 investment actually worth it?"
To figure that out, you calculate your ROE (Return on Equity). You take that $150 profit and divide it by your original 1,000 investment. The result is 15%.
Think of that 15% as the "speedometer" for your business. It tells you exactly how much "juice" you’re squeezing out of every dollar you and your friends tucked into that cash box. It’s the quick and dirty way to see if your money is just sitting there or if it’s actually working hard for you.
“Understanding the concept is important, let's break down exactly which are the 2 Ingredients of ROE.
The Two Ingredients of ROE
Think of ROE as a report card for how well a company uses its owners' money. To calculate it, you really only need to understand two key "ingredients."1. Net Income: The "Take Home Pay."
Net Income is basically what’s left in the register at the very end of the year. It’s the "Bottom Line" because, after you pay your employees, the light bill, the bank’s interest, and the government’s taxes, this is the actual profit.- The Logic:
- Revenue: Every single dollar that walked in the door from sales.
- Expenses: Everything that walked back out from the literal cost of making the product (COGS) to the CEO’s salary and interest on the company's credit cards.
The Formula
Net Income = Total Revenue - Total Expenses
2. Shareholder Equity: The "Owner’s Stake."
If a company decided to close up shop tomorrow, sell every desk and patent it owns (Assets), and pay off every penny it owes to the bank (Liabilities), whatever is left over belongs to the shareholders. That "leftover" is Equity.The Formula (Accounting Equation):
Shareholder Equity = Total Assets - Total Liabilities
It is also composed of two main parts:
- Contributed Capital: Money raised by issuing shares to the public.
- Retained Earnings: Cumulative profits that the company has kept rather than paying out as dividends.
“Now that we understand what Return on Equity means, let’s break down exactly how to calculate it step-by-step.”
Read More: A Beginner's Guide to the Indian stock market.
Step 1: Finding the Net Income on an Income Statement
If you want to see how much cash a company actually walked away with, you’ve got to check out the Income Statement. In the finance world, we call this the "Bottom Line" for a very literal reason: the page starts with all the money flowing in at the very top, and after you’ve chipped away at all the expenses and taxes, that final number sitting at the very bottom is your actual profit.- Start at the "Top Line": The statement kicks off with Total Revenue (or Net Sales). This is the raw cash coming in from customers before a single penny is taken out.
- Subtract Direct Costs: First, account for the Cost of Goods Sold (COGS). These are the literal expenses tied to making your product, think of raw materials or factory labor. Once you subtract those, you’re left with Gross Profit. Think of this as a "gut check" number.
- Factor in the Daily Grind: Next, account for Operating Expenses (marketing, R&D, and office salaries). This leaves you with Operating Income, which shows if the core business can actually stand on its own two feet.
- Handle the "Non-Core" Extras: Below the operating line, the company deals with things that aren't part of the daily hustle, like interest expenses and taxes.
- Spot the "Bottom Line": The final figure is your Net Income. This is the pure profit left for the owners. Just a heads up: if you see this number inside parentheses like (50,000), it means the company actually lost money.
"With our ingredients prepped, it's time to go hunting through the paperwork to find the first piece of our puzzle: the company's true 'take-home pay'."
Step 2: Identifying Average Shareholders' Equity
When you're calculating financial ratios, a single snapshot usually isn't enough. You need the Average Shareholders' Equity, which requires looking at two different points in time on the Balance Sheet.- Locate the "Equity" Section: Scroll past Assets and Liabilities. You’re looking for "Shareholders’ Equity." This is the "ownership" part of the company.
- Identify Total Equity: Look for the line titled "Total Shareholders' Equity."
- Pull the "Beginning" Balance: Look at the prior period’s total (e.g., Dec 31, 2024).
- Pull the "Ending" Balance: Look at the most recent column (e.g., Dec 31, 2025).
- Calculate the Average:
Average Shareholders' Equity = Beginning Equity + Ending Equity / 2
"We’ve found the profit, but profit is only half the story; now we need to measure the 'engine' that produced it by diving into the balance sheet."
Step 3: Performing the Calculation
Alright, so you’ve finally pinned down your Net Income and that Average Equity figure. Now the real fun starts. This is where you actually figure out if a company is a legit profit machine or if it’s just spinning its wheels and wasting everyone’s time.Let’s look at some real-world numbers so this makes sense. Say a business clears 10,000 in Net Income, while the Average Equity, basically the cash the owners have tied up in the thing, sits at 50,000.
When you sit down and run the math:
10,000 / 50,000 = 0.20
To make that something you can actually use, you just flip it into a percentage: 20%.
So, what’s that 20% really telling you? In plain English, it means that for every single buck the shareholders have "parked" in the business, the company managed to squeeze out 20 cents in pure, bottom-line profit. In the investing world, that’s a pretty solid "speedometer" reading. It proves the business actually knows how to put the owners' cash to work instead of just letting it sit there gathering dust.
Read More: A Fundamental Checklist: How to read a profit and loss statement in just 10 mins.
Let’s understand everything by taking the example of an imaginary company, TechNova, and break it down
Example: TechNova
Step 1: Find the Net Income & Equity
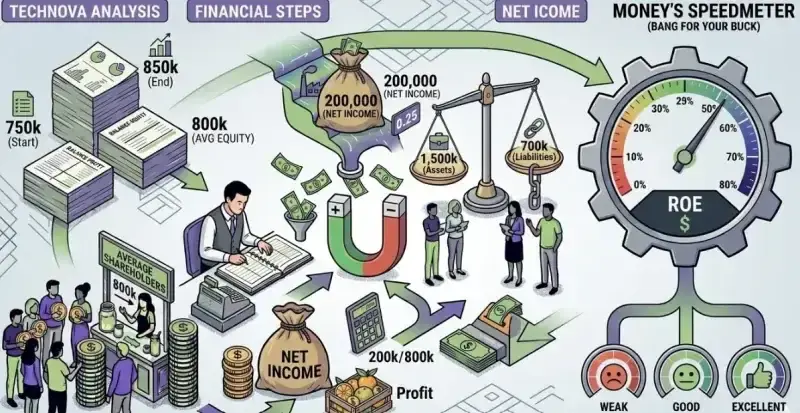
Let's assume TechNova has:- Net Income: 200,000
- Total Assets: 1,500,000
- Total Liabilities: 700,000
- Equity: 800,000
Step 2: Figure Out the Average Equity
- Start of Year: 750,000
- End of Year: 850,000
- Average: (750,000 + 850,000) / 2 = 800,000
Step 3: The Final ROE
- 200,000 / 800,000 = 0.25
- ROE = 25%
What does this 25% mean? It means TechNova is performing excellently. In most industries, a 15–20% ROE is considered strong. It tells investors that management is very efficient at turning reinvested cash into growth without drowning in debt
Read More: A Fundamental Checklist: How to Research a Stock in 1 Hour.
Case Study: A Tale of Two Bakeries Why All Profits Aren't Created Equal
Imagine two bakeries sitting side by side on a busy corner: The Cupcake Cloud and The Grand Grainery. To anyone walking past, they both look like massive hits. They both have lines snaking out the door, and they both smell incredible.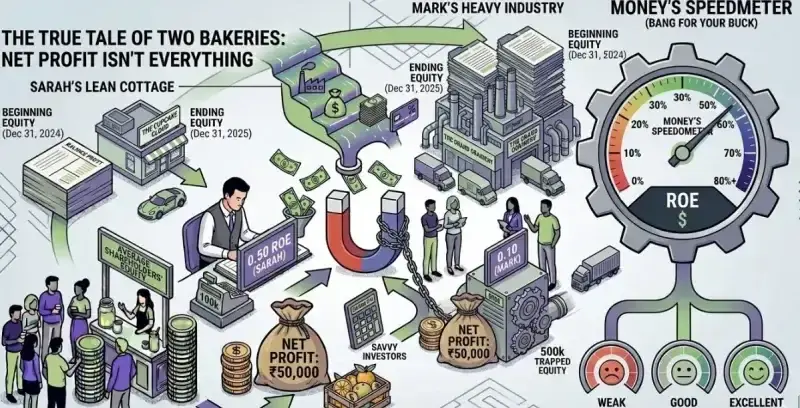
At the end of the year, the owners, Sarah and Mark, sit down to tally the wins. Both shops cleared exactly ₹50,000 in net profit. On the surface, it looks like a tie: same town, same niche, same bottom line. But when they walk into the bank to ask for an expansion loan, the manager sees a totally different story. To him, one business is a high-performance sports car, while the other is a heavy, gas-guzzling semi truck.
The banker isn't just looking at the ₹50,000 profit; he’s looking at what it took to get there. Sarah (The Cupcake Cloud) is running a lean operation with minimal equipment and low overhead.
Whereas Mark (The Grand Grainery) has millions tied up in massive industrial ovens and a fleet of delivery vans. Even though the "take-home" pay is the same, Sarah’s money is working ten times harder.
The "Skin in the Game" Reality Check
The banker looked past the 50,000 profit and focused on Average Shareholders' Equity. In plain English, he wanted to know how much "stuff" (cash, ovens, property, and equipment) was tied up in the business to actually produce that profit.- Sarah is the "lean" operator. She rents a small kitchen and grows by word-of-mouth. With only 100k tied up in the business, her money is working overtime. If the market shifts tomorrow, she can pivot in the afternoon without breaking a sweat.
- Mark, on the other hand, is hauling a heavy sled. He bought the building, a fleet of vans, and ovens that cost more than a house. He has 500k "trapped" in the shop. He isn't just baking; he’s babysitting a massive, expensive machine that’s a nightmare to maintain and even harder to move.
The Moment of Truth: The ROE Reveal
To find out who was actually the better manager, the banker calculated the Return on Equity (ROE). Think of ROE as an "efficiency detector." It shows exactly how many cents of profit you get back for every dollar of equity you’ve locked into the company.
Why Sarah is the "Efficiency Queen"
The banker approved Sarah’s loan almost instantly. Why? Because Sarah is generating 50 cents of profit for every dollar she has in the game. She’s agile, low-overhead, and incredibly effective.
Mark, however, is pulling a much heavier sled. He has to manage, insure, and maintain 500,000 worth of assets just to make the same 50,000 Sarah makes. He has five times more money "trapped" in the shop, meaning his capital is working five times less effectively than hers.
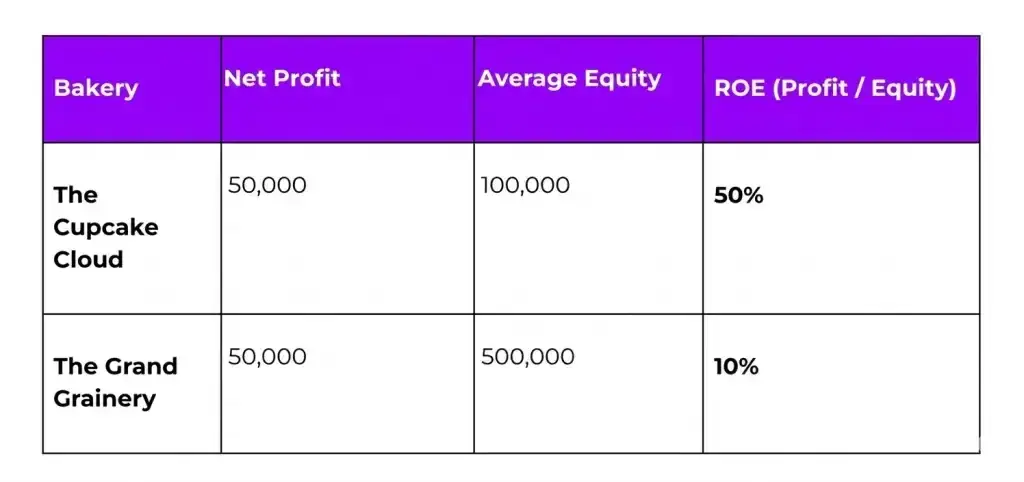
If you had 1,000 to invest, you’d give it to Sarah every single time. She turns cash into more cash faster than Mark can preheat his industrial ovens.
The Moral: Net Income tells you how much a company made, but ROE tells you how smart they were while making it.
“With the calculations mastered and the real-world lessons clear, let’s bring everything together.”
Read More: Top Undervalued Stocks in India Based on PE, PB & ROE
Explore our Products
Research Framework

Emerging Titans
Combination of quantitative analysis, industry tailwinds, and management assessment - SPRINT investment philosophy

Tiny Titans
Heavy emphasis on scuttlebutt research, plant visits, and early on-ground signals
Conclusion and CTA
At the end of the day, Net Income tells you how much a company made, but ROE tells you how smart they were while making it. Think back to our two bakeries: Sarah and Mark banked the same profit, but Sarah did it with a fraction of the resources. That’s the "secret sauce." A big profit is great, but if it takes a mountain of expensive equipment and heavy debt to get there, it’s not a true win.By mastering this three-step calculation, you're giving yourself a financial X-ray. You can stop guessing and start seeing which management teams are actual "wizards" and which ones are just babysitting expensive assets. ROE is the ultimate report card. It shows you how hard your dollars are actually working to build wealth.
If this guide helped you to think systematically, comment “WEALTH” below with your own stories or questions!
Investor FAQs & Screening Tips
Is a higher ROE always a green light?
+Not exactly. While a high number looks great on paper, you have to look under the hood. A company can "cheat" its way to a high ROE by taking on a mountain of debt. Since Equity is just Assets minus Liabilities, more debt makes the Equity number smaller, which makes the ROE look huge even if the business is struggling. If the ROE is high but the company is drowning in loans, tread carefully.
What’s considered a "good" score?
+Think of it like a grade on a curve. A 15% to 20% ROE is generally the "sweet spot" for high-quality companies. But context is everything. A software company doesn't need to buy much more than laptops and servers, so their ROE might be 30%+. A utility company that has to build power plants and power lines might be a rockstar at 12%. Always compare a company to its "neighbors" in the same industry.
Why bother with "Average" Equity? Why not just use today's number?
+Think of it like measuring a tree’s fruit: you wouldn't just look at its size on the very last day of harvest. Since Net Income is earned over a full 365 days, using Average Equity ensures you are matching that profit against the actual capital the company had to work with as the months passed. It stops the math from being skewed by big changes like mid-year share buybacks or massive reinvestments, giving you a much more honest "speedometer" reading.
Can ROE go into the negatives?
+It can, and it's usually a warning sign. A negative ROE happens when a company is losing money (Net Loss). You’ll see this a lot with brand new startups "burning" cash to grow. However, if an established company has a negative ROE, it often means they owe more than they own, which is a major red flag that the business might be heading for a crash.
ROE vs. ROA: What's the real difference?
+Think of ROE as the return on your money, while ROA (Return on Assets) is the return on all the money (including what they borrowed from the bank). If a company’s ROE is way higher than its ROA, it’s a sign that they are using a lot of "leverage" (debt) to boost their results. It’s a classic high-risk, high-reward move.

High growth stock specialist, Value Educator
Shashank Mahajan is an equity research professional with over 12 years of experience in identifying high-potential SME and micro-cap stocks at an early stage. He follows a rigorous scuttlebutt research–driven approach, combining on-ground insights with deep financial analysis. Shashank specializes in uncovering under-researched and under-owned companies with strong management quality and long-term growth potential. Through disciplined research and early identification, he focuses on spotting tomorrow’s market leaders before they enter the mainstream investor radar.

Glenmark: The USD 700 Mn Cancer Deal and Its Brands

Pharma Stocks in India 2026: Generics, APIs and CDMOs
Granules India: From Paracetamol to a 65% Gross Margin

Natco Pharma: After Revlimid, 29 Patent Challenges

Shilpa Medicare: Cancer APIs, Films and Biosimilars

Alembic Pharma: US Plants Pay Back, Margin Hits 22.2%
Explore our Products
Research Framework
Emerging Titans
Combination of quantitative analysis, industry tailwinds, and management assessment - SPRINT investment philosophy
Tiny Titans
Heavy emphasis on scuttlebutt research, plant visits, and early on-ground signals



Modern Warfare to Multibaggers
Key Trends. Strategic Shifts. Opportunities Ahead.
Today at 7:00 PM IST. Room opens 30 minutes before.
Don't Miss This Exclusive Webinar!
Join Value Educator to decode the key trends shaping India's defence sector and learn how to identify tomorrow's potential leaders in the space.
- In-depth research on India's defence sector
- Live Q&A session
- Actionable takeaways for long-term investors

 Orders
 Subscription
 Share with friends


Required Details
₹23999.00
(12 month subscription)
As per SEBI regulations, all users are mandated to complete the KYC that is validated for 1 year. Post payment, you will be redirected to the KYC screen


No comments yet. Be the first to comment!