
What Is Value Investing? A Beginner's Guide

“Price is what you pay. Value is what you get.” - Warren Buffett
This quote holds deep meaning and it’s not just theory. Even big Indian investors like Vijay Kedia and Parag Parikh have built their investing journeys by following the same approach. To understand what this actually looks like in practice, let’s take an example.
Picture your favourite TV that normally sells for ₹20,000. Now imagine walking into a store one day and seeing that very same TV priced at just ₹7,000. Same model, same brand and same quality. The TV’s intrinsic value - what it’s actually worth to you - is still ₹20,000. But the market is offering it at a huge discount.
That ₹13,000 gap isn’t just a great deal, it’s your margin of safety.
This is exactly how value investing works. You're not buying random “cheap” stuff. You're buying something valuable, at a price that makes sense and then having the patience to wait until the world catches up.
Let’s try to understand this concept through a real life case study:
“The stock market is a device for transferring money from the impatient to the patient.” - Warren Buffett
And this is where most people lose money - they want results fast. Value investing is the opposite: you buy with patience and let time do the heavy lifting. That’s why the next case study matters.
If you’re new to markets, you can quickly read these two first: A Beginner’s Guide to the Indian Stock Market
For years, ITC was ignored - even though the business kept delivering.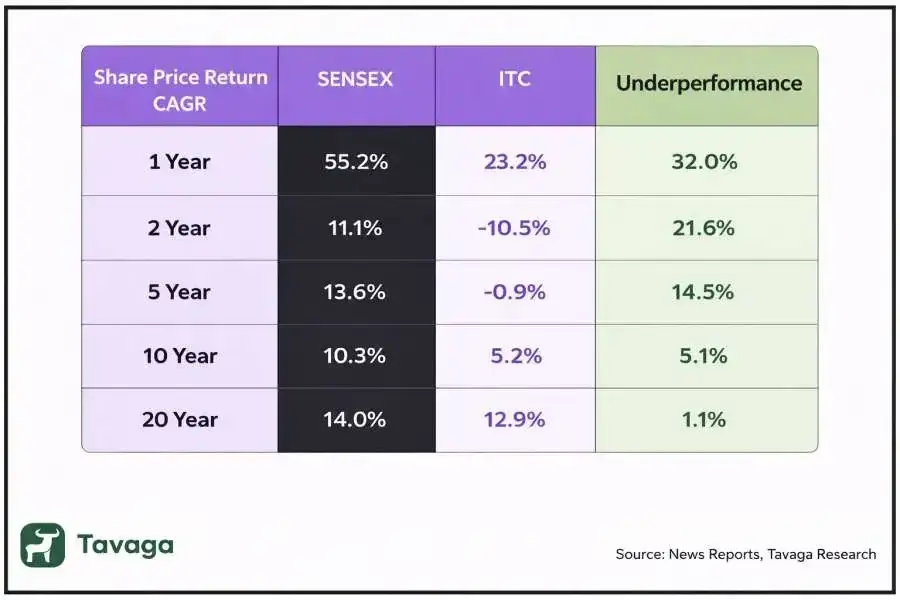
Above table Data Based on 2021
Despite being India’s second-largest FMCG company after HUL, generating strong cash flows and holding a solid balance sheet, ITC’s stock price barely moved for nearly a decade. In fact, it underperformed the Sensex by 5.1% over 10 years, and by a staggering 32% in just one year at one point.
While the rest of the market raced ahead, ITC stayed stuck - flat, forgotten, and frustrating.
But here’s the thing: stock price isn’t the same as business performance.
While the market looked away, value investors leaned in — because beneath the stagnant price, ITC was doing what strong businesses do best:
- Generating a consistent free cash flow of Rs. 11,700 crore in FY20
- Maintaining a high dividend payout ~85% of profits
- Sitting on ₹25,000+ crore in cash, with little to no debt
- Trading at lower P/E and P/B ratios than sector peers like HUL and Nestlé
If any terms like P/E, ROE, or cash flow feel confusing, this will help:10 Stock Market Terms Every Beginner Must Know
ITC wasn’t a broken company, it was an undervalued one.
The market had priced in all the negatives: the “sin stock” tag from its cigarette business, slow growth in its newer FMCG segments, and a bloated hotel division. But what it hadn’t priced in was the underlying strength of the core business - and the potential for value unlocking.
ITC was the perfect example of a strong business trapped in a weak stock. But like most value stories, the quiet shift came and things began to change.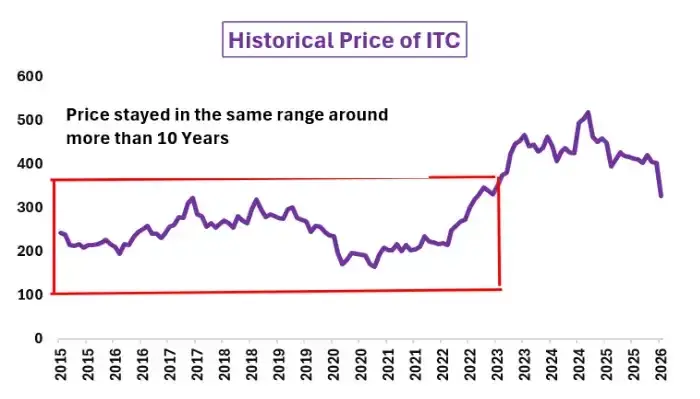
Around late 2021 to 2022, the market began to notice what patient investors had seen all along:
- Domestic mutual funds started increasing their holdings
- Talks of demerging the cigarette and FMCG businesses gained momentum.
- Management hinted at monetising non-core assets like the hotel segment
- The FMCG vertical showed signs of maturing, with improving margins
Slowly but surely, sentiment shifted. And so did the stock price.
From being stuck around Rs. 160-200 for years, ITC began to climb, eventually crossing ₹450+ by 2023–24. Those who stayed invested, gained prices moving up over time.
“Know what you own, and know why you own it.” - Peter Lynch. So it is wise to be an educator investor.
So rather than guessing or blindly following tips, let’s keep things simple and logical. Here are 3 beginner-friendly steps, starting from the economy, narrowing down to the right company, and finally checking if it’s worth the price. We’ll use the Tyre Industry as an example to guide you through it.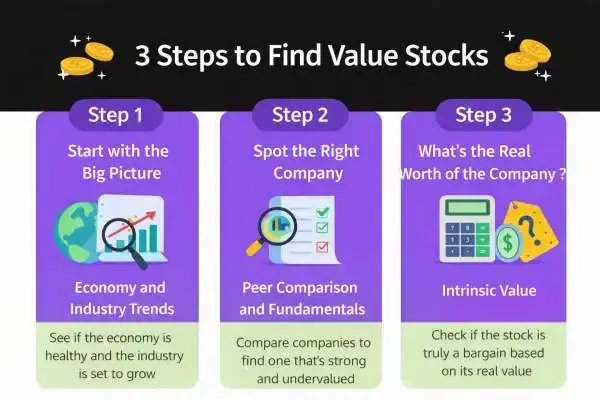
Step 1: Start with the Big Picture - Economy and Industry Trends
To find a value investing opportunity, you first need to zoom in on the company but only after you’ve taken a good look at the bigger picture.Before putting money into any stock, it helps to slow down and look at the bigger picture first. A simple question goes a long way: how is the overall economy doing? Even the best-managed company can struggle if the broader environment isn’t supportive. Once you’re reasonably clear about the economic backdrop, the next step is to look at the industry the company belongs to.
Take the auto ancillary sector, for instance. Is India’s auto industry likely to grow over the coming years?
Studying the industry helps you think clearly on three key aspects.
Growth Potential - Is this a space that’s still expanding with enough room to grow, or has it already become mature and crowded?
Valuation Context - Are companies in this sector trading at expensive levels, or are valuations reasonable when compared to past averages like long-term P/E ratios?
Risk Exposure - How does the sector behave during tough phases, such as pandemics, sudden jumps in raw material prices, or unexpected regulatory changes?
To get a quick sense of the bigger picture, you don’t always need deep research reports. Even a simple online search can give useful directions. For example, as we have taken the Auto ancillary industry as an example: Reports suggest that the Indian tyre industry could reach close to USD 21.27 billion by 2030, growing at around 12.17% annually. This growth is largely supported by higher vehicle production, better infrastructure, rising income levels, and steady export demand.
Once you’ve understood the economy and industry, it’s time for the next step: comparing companies within the sector. The goal? Find a business that’s fundamentally strong with steady cash flows, low debt, solid leadership and trading below its true worth. That’s where real value investing begins.
If you want a quick research process to follow every time, use this: How to research a stock in 1 hour.
Step 2: Spot the Right Company - Peer Comparison and Fundamentals
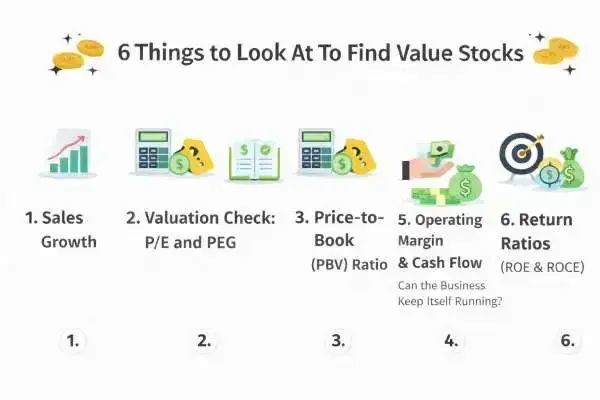
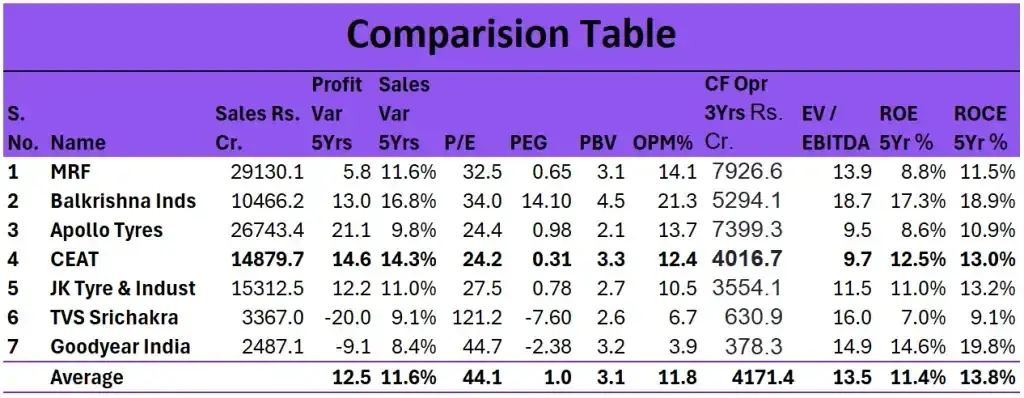
1) Sales Growth & Profit Growth
a) Sales Growth-
One of the first things a value investor looks for is consistent and healthy top-line growth, not flashy short-term spikes, but sustainable momentum over years.
So let’s look at the 5-year sales growth rates of a few top tyre companies:
- CEAT - 14.29%
- MRF - 11.63%
- Apollo Tyres - 9.83%
- JK Tyre - 10.99%
- Balkrishna Industries - 16.77% (but there’s a catch)
Yes, Balkrishna leads the pack in growth, but it’s also trading at a steep valuation (P/E over 34). That doesn’t quite fit the “value” bill.
CEAT, on the other hand, delivers strong growth at 14.29%, while still keeping its valuation reasonable at P/E around 24. That balance with solid fundamentals at a fair price is exactly what a value investor looks for.
b) Profit Growth (5-Year)
Profit growth is also an important parameter to identify value investing. Over the last 5 years, CEAT’s profit has grown by about 14.6%, which is better than the industry average of roughly 12.5%. Some companies have done better, like Apollo at 21.1%, but a few players are even in negative territory which clearly isn’t a good sign.
What makes CEAT interesting is that it’s still smaller than MRF and Apollo. As its sales scale up, it can benefit from operating leverage, fixed costs get spread out, so profits can grow faster. This “profits rising with room to expand” setup is exactly what value investors like.
2) Valuation Check: P/E and PEG - Are You Paying the Right Price?
After spotting a promising industry and confirming that a company has steady growth, the next step is simple but critical: ask yourself, “Am I paying too much for this business?”That’s where two important valuation tools come into play: the Price-to-Earnings (P/E) ratio and the PEG ratio.
The P/E ratio simply shows how much investors are willing to pay today for every ₹1 the company earns. A lower P/E can point toward a good deal, as long as the business is still growing and not slipping into long-term decline.
But P/E alone can be misleading. That’s why smart investors also look at the PEG ratio - which adjusts the P/E for the company’s growth rate. It shows whether you’re paying a fair price relative to how fast the business is expanding. A PEG below 1 usually means the stock is undervalued for the growth it offers.
Let’s put this into context using our tyre industry comparison:
Among the listed players, CEAT clearly stands out. It has a relatively low P/E of 24.2, far more reasonable than companies like MRF (32.5), Balkrishna (34.0), or Goodyear India (44.7). But more importantly, its PEG is just 0.31, which is well below the ideal threshold of 1. This suggests the market hasn’t yet fully priced in its growth - a classic trait of a value stock hiding in plain sight.
In contrast, while Apollo Tyres also has a decent P/E, its PEG is .98, making it fairly priced but Ceat has better growth opportunity.
3) Price-to-Book (PBV) Ratio - What Are You Really Paying For?
PBV compares a company’s market price to its book value - basically, its net worth. A lower PBV means you're paying less for the company’s assets.In the tyre sector:
- CEAT has a PBV of 3.3 — slightly higher than some peers like Apollo Tyres (2.1), but still in a reasonable range.
- Balkrishna (4.5) looks expensive, especially given its high PEG ratio.
- Goodyear (3.2) also doesn’t offer much value considering weaker profitability and growth.
Yes, CEAT has a higher PBV compared to some peers, but when you factor in its consistent growth, better PEG, healthy ROE/ROCE, and strong fundamentals, that valuation looks justified.
4) EV/EBITDA - Core Profit vs. What You Pay
EV/EBITDA shows how expensive a company is based on its actual operating earnings.In our comparison:
CEAT currently trades at a lower EV/EBITDA compared to peers like MRF and Balkrishna Industries, which makes it look more reasonably valued when you focus purely on core operating earnings.
On the other hand, MRF and Balkrishna command much higher EV/EBITDA multiples, suggesting that investors are paying a clear premium, despite growth prospects that are similar or in some cases, even lower. For value investors, a lower EV/EBITDA signals that you’re getting solid operational value without overpaying - and CEAT checks that box well.
5) Operating Margin & Cash Flow - Can the Business Keep Itself Running?
Once the valuation feels reasonable, the next step is to see how efficiently the company runs its core operations and whether it’s actually generating real cash.Operating margin shows how much profit a company retains from its core business after meeting operating expenses. At the moment, CEAT’s margins are lower than peers like MRF and Balkrishna Industries, largely because CEAT operates at a relatively smaller scale.
But here’s the upside: as CEAT’s sales continue to grow, it benefits from operating leverage - meaning fixed costs get spread over more units, and margins improve. That’s a long-term strength value investors love.
Now, let’s talk about cash flow, because paper profit isn’t enough. Over the last 3 years, CEAT has consistently generated positive cash flow from operations, and in some periods, its cash generation relative to profit has even outpaced bigger players.
6) Return Ratios (ROE & ROCE)
- ROE tells you how efficiently a company generates profit from shareholders’ equity.
- ROCE goes a step further and shows how well the business uses both debt and equity to generate returns.
For value investors, these are critical metrics - because a company might look cheap on the surface, but if it’s not using capital wisely, returns can stay muted.
In CEAT’s case, its 5-year average ROE is 12.5%, and ROCE is 13.0%, both above or in line with the industry average. That’s a strong indicator of capital efficiency, showing CEAT knows how to put money to work, even without premium pricing or flashy valuations.
That’s a key marker of a healthy, investable business: steady margins and reliable cash flow.
So far, we’ve looked at the bigger picture - the economy, the industry, and how the company stacks up against others. Now comes the most important part of value investing: is the stock price fair? To answer that, we have a quote: “Margin of safety is the central concept of investment.” - Benjamin Graham. The main question: is the stock selling at a discount to what it’s really worth? That’s where intrinsic value and margin of safety come in.
If you want to explore value beyond large caps, you can read our article:
The Hidden Micro-Cap Stocks That Could Lead India’s 2026 Growth Cycle
STEP 3: What’s the Real Worth of the Company? - Intrinsic Value
This is the heart of value investing: “Buy something for less than it’s truly worth.” But the real challenge is this - how do you figure out what a company is actually worth?The market gives you a price every day, but that price can swing because of fear, excitement, news, or short-term sentiment. A value investor tries to look beyond that and estimate the business’s real value based on its earning power, cash generation, and long-term potential. Once you have a fair idea of that “true worth,” you can decide whether the stock is available at a discount or not. That’s where valuation comes in.
Here are four common ways investors estimate a stock’s intrinsic value:
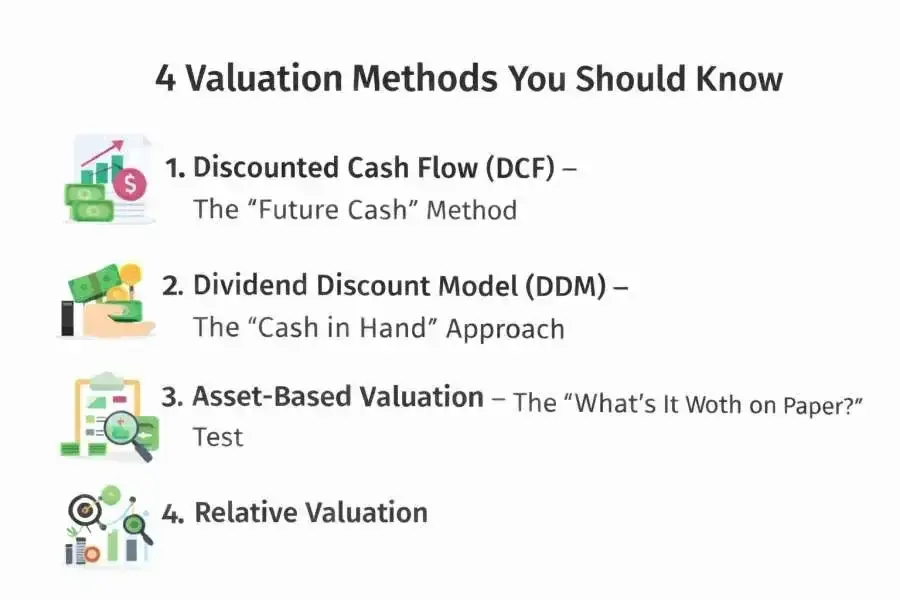
- DCF - Discounted Cash Flow
Focuses on future cash flows, because cash is what runs a business. It asks: If I owned this company, how much cash would it generate in the future, and what is that worth today? - DDM - Dividend Discount Model
Values a stock based on the future dividends it can pay to shareholders. - Asset-Based Valuation
Look at the company’s net worth on paper: assets minus liabilities. - Relative Valuation
Compares the stock’s valuation with similar companies.
Now, honestly, for beginners, methods like DCF and DDM can feel heavy because they depend on assumptions and calculations. Even professionals can come up with different values, so it’s normal if you don’t want to go deep into valuation math in the beginning.
Just Google the company’s name followed by “research report.”
For example: “CEAT research report 2026.”
You’ll find research reports from brokers, financial platforms, and investment firms. Most of them include a target price, which is often the analyst’s estimate of intrinsic value. You can read a few reports and take the average of those target prices to get a rough idea of what the market thinks the stock is worth.
It’s not perfect, but for a beginner, it’s a smart and practical place to start.
If you want a step-by-step method to find long-term winners like this, read: The Multibagger Framework: A Step-by-Step Guide to Finding 10x Stocks
Final Thoughts:
Value investing is about buying a business for less than what it is truly worth. Stocks often trade below their intrinsic value not because the company suddenly became weak, but because markets are influenced by fear, uncertainty, short-term news, and investor sentiment.
For beginners, the real challenge is not spotting low prices but correctly identifying true value. That requires patience, basic financial understanding, and the ability to ignore market noise. To make this easier, we simplify the approach into three practical steps: first, understand the economy and industry; second, compare and shortlist strong businesses; and third — the most crucial step — estimate intrinsic value to ensure there is a genuine margin of safety.
When followed consistently, this process helps build clarity, discipline, and the long-term mindset that successful investors rely on.
Comment “VALUE” if you’d like more such frameworks on investing and stock analysis.
Explore our Products
Research Framework

Emerging Titans
Combination of quantitative analysis, industry tailwinds, and management assessment - SPRINT investment philosophy

Tiny Titans
Heavy emphasis on scuttlebutt research, plant visits, and early on-ground signals
FAQs:
What exactly is value investing?
+Value investing means buying something valuable at a discounted price. The article explains it using the TV example: if a TV worth ₹20,000 is available for ₹6,000, you’re not buying “cheap junk”. You’re buying real value on discount. That difference between what it’s worth (intrinsic value) and what you pay (market price) is the real opportunity.
What is “intrinsic value” and “margin of safety”?
+Intrinsic value is the real worth of a business based on its strength (earning power, cash generation, long-term potential). Margin of safety is the gap between intrinsic value and the current market price. The bigger this gap, the safer it is because even if you’re slightly wrong, you still have a cushion. The guide says this is the central idea of value investing.
Why does patience matter so much in value investing?
+Because sometimes the business performs well but the stock price stays stuck for a long time. The ITC example shows this clearly: ITC delivered strong cash flows, high dividends, cash reserves, low debt, yet the stock underperformed for years. Patient value investors wait until the market finally “notices” the value - which happened when sentiment changed and the stock price started rising later.
How can a beginner identify value stocks using a simple process?
+Start with the industry (strong sector is safer), then compare a few companies on sales/profit trend, margins, debt, cash flow, and ROE/ROCE. After choosing the stronger business, check if it’s available at a fair/discounted valuation using ratios like P/E, PEG, PBV, or EV/EBITDA. Aim for good business + good price.
How do you decide whether a value stock is worth buying (not a value trap)?
+Cheap doesn’t always mean valuable. Make sure the company has stable earnings, healthy cash flow, manageable debt, and decent returns, and the low price is due to a temporary issue or market negativity. If profits keep dropping, debt keeps rising, or cash flow is weak, it’s likely a value trap.

High growth stock specialist, Value Educator
Shashank Mahajan is an equity research professional with over 12 years of experience in identifying high-potential SME and micro-cap stocks at an early stage. He follows a rigorous scuttlebutt research–driven approach, combining on-ground insights with deep financial analysis. Shashank specializes in uncovering under-researched and under-owned companies with strong management quality and long-term growth potential. Through disciplined research and early identification, he focuses on spotting tomorrow’s market leaders before they enter the mainstream investor radar.

Zen Technologies: Revenue Fell After a Big Win




PNG Jewellers: A 194-Year-Old Name Goes National

Explore our Products
Research Framework
Emerging Titans
Combination of quantitative analysis, industry tailwinds, and management assessment - SPRINT investment philosophy
Tiny Titans
Heavy emphasis on scuttlebutt research, plant visits, and early on-ground signals


 Orders
 Subscription
 Share with friends


Required Details
₹23999.00
(12 month subscription)
As per SEBI regulations, all users are mandated to complete the KYC that is validated for 1 year. Post payment, you will be redirected to the KYC screen


No comments yet. Be the first to comment!