
Park Medi World: Affordable Care, Fast Growth

Imagine someone in a Tier-2 Indian city, somewhere with a highway running through it but no metro skyline. Someone suddenly collapses — a stroke, say. The nearest tertiary-care hospital with the right specialists may be hours away by road. In that moment, the hospital with the marble lobby three hours away is almost irrelevant. What matters is the facility fifteen minutes from home that has a neurologist on duty, a working CT scanner and a bed available. Hospitals like that are what Park Medi World builds.
That is a side of Indian healthcare that is easy to miss when the industry is viewed mainly through the lens of large cities and premium hospitals. Outside the metros, distance can be just as important as reputation. A hospital does not necessarily have to be the most expensive or the most recognised in the region to become indispensable. Sometimes, simply being there when the patient needs it is what matters. And that creates a very different healthcare opportunity one built around access, patient volumes and bringing specialised treatment closer to where people live.
For a company operating in this part of the market, the opportunity is not about building the biggest or fanciest hospital. It is about making sure there is a capable one within reach when the need arises. That means building in the right locations, keeping treatment relatively affordable, maintaining the infrastructure to handle serious cases and gradually developing the specialists and patient volumes needed to make those hospitals economically viable.
That is the space Park Medi World Limited has been building around for more than two decades.
Not the marble-lobby version of healthcare. The fifteen-minutes-away version.
High-end tertiary and quaternary healthcare has historically been concentrated in India's major metros. Park Medi World built its business on the view that this gap was an opportunity — one that has historically been less attractive to premium-focused hospital chains, largely because of the lower pricing and different payer mix that comes with serving it.This broader healthcare opportunity is worth understanding before looking at Park specifically. For a wider view of how hospital businesses can benefit from India’s rising healthcare demand, read The Hospital Chain Riding India’s Healthcare Demand Boom.
"Buy not on optimism, but on arithmetic." — Philip Fisher
That line is worth keeping in mind through everything that follows, because the arithmetic — beds, occupancy, receivables, capex per bed — is really where this story lives.
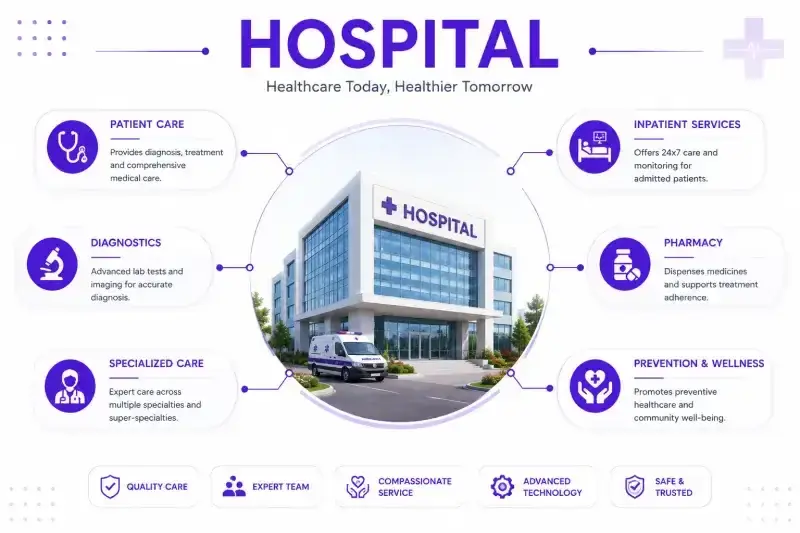
Park Medi World's Business Model: Beds, Occupancy, ARPOB
“Know what you own, and know why you own it.” — Peter Lynch
At its simplest, hospital revenue is a function of three variables: available beds, occupancy, and ARPOB. EBITDA then depends on how efficiently that revenue converts after employee costs, consumables, professional fees, and other operating expenses. Put another way:Beds increases the Occupancy increases that results in increased ARPOB which directly increases Revenue growth. (Revenue growth + operating leverage → EBITDA growth)
Nearly every structural choice Park has made traces back to that chain.
Full-time doctors, not visiting consultants. Every clinician on Park's roster is a full-time employee. Management is explicit that doctors aren't evaluated on the revenue or patient volume they personally generate — they're scored on patient and attendant satisfaction and on clinical outcomes, through an internal percentile system, with a performance bonus and an ESOP layered on for those who consistently score well. According to management, this keeps consultant-level attrition among the lowest in the industry, with company estimates in the high-teens percentage range. It's worth flagging, though, that the company's own IPO prospectus — from a somewhat earlier period — disclosed a considerably higher blended doctor attrition figure, close to a third of the workforce, driven mostly by resident medical officers rather than senior consultants. Both figures can be true at once; they're measuring different slices of the same workforce.
A deliberately low-capex build and acquisition model. Park has historically built and acquired hospitals at roughly ₹34-37 lakhs per bed, according to management — reportedly less than half of what some competitors spend. Part of this comes from bed configuration (a meaningful share of twin-sharing beds alongside a dedicated critical-care allocation), and part from targeting distressed, already-built assets rather than raw land, where a suitable target exists.
An affordability-first payer mix. In the quarter ended June 2026, roughly 77% of revenue came from government insurance schemes — CGHS chief among them — with the rest split across cash, TPA, and private insurance, according to management on the Q1 FY'27 call (August 4, 2026). That's down from an 89% government-scheme dependence the company reported for FY25, and management has guided toward a more balanced 70:30 split over the next 12-18 months.
"I want a business any idiot can run, because sooner or later, one will." — Charlie Munger
Park's standardized SOPs and management-training pipeline seem built with almost exactly this in mind — a model designed not to depend on any single hospital's founding team.
Why Park Can Compete on Price Management estimates that the affordability-focused segment of Indian healthcare — patients who can't access or afford premium, metro-centric hospital chains — represents roughly 90-92% of the population. Whether or not that precise figure holds up to scrutiny, the broader point is directionally well-supported by Park's own patient mix, which skews heavily toward government-scheme beneficiaries.
Park's low ARPOB, relative to listed peers, may be more than a pricing disadvantage. In our view, it can function as a competitive advantage if the company's lower-cost operating model lets it profitably serve a large, affordability-focused patient pool that larger, premium-oriented hospital chains have less commercial incentive to chase. The trade-off, though, is real: a lower ARPOB requires Park to compensate through occupancy, asset turnover, and disciplined capital deployment rather than through pricing power.This is also where the idea of an economic moat becomes important a low-cost model only creates a durable advantage if competitors struggle to replicate it.Economic Moat Explained: Why Some Companies Stay Dominant for Decades
If any one of those three slips, the model has less room to absorb it than a premium chain with higher per-bed revenue would.
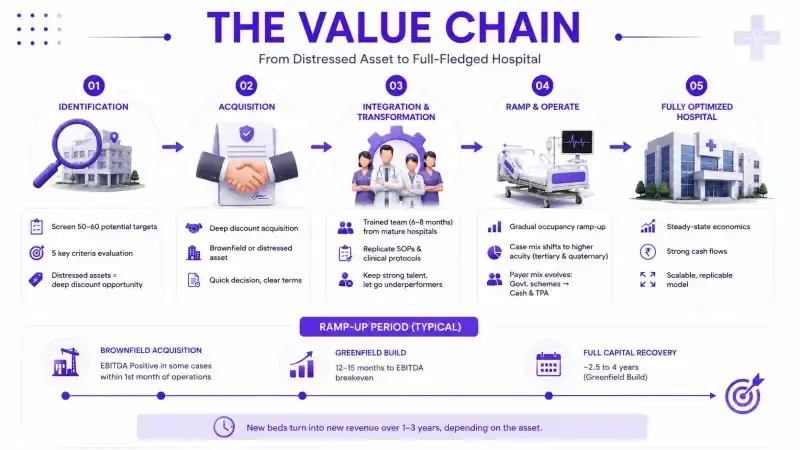
The Value Chain:
The way Park actually adds a hospital to its network says more about the investment case than any single quarter's numbers.
It starts with identification. Management has referenced screening 50-60 potential targets historically, evaluated against roughly five criteria: strategic location, local disease burden and specialty strength, existing infrastructure, headroom to expand, and — specifically for distressed brownfield assets — how much financial trouble the seller is in, since that distress is usually what makes a deep-discount acquisition possible in the first place.
Once a target is picked, the playbook kicks in. Management from mature, existing hospitals — trained for roughly six to eight months, according to Q1 FY'27 commentary — gets moved into the new unit to replicate Park's SOPs and clinical protocols, rather than inheriting whatever systems (or dysfunction) came with the asset. Underperforming staff are usually let go; staff who meet Park's bar stay on.
Then comes the ramp, and it isn't instant. A newly acquired or newly commissioned hospital typically needs anywhere from several months to a few years to reach steady-state economics. A brownfield acquisition can turn EBITDA-positive, even PAT-positive, within its first operating month in some cases, according to management. A full greenfield build is slower — management has cited a 12-15 month runway just to EBITDA breakeven, and closer to two-and-a-half to four years before the invested capital is fully recovered. Occupancy climbs gradually, the case mix shifts toward higher-acuity tertiary and quaternary work as volumes justify the equipment, and the payer mix slowly tilts away from government-scheme-heavy toward more cash and TPA as the hospital builds a local reputation. This is a slow-cooked business, and it's worth saying plainly: new beds don't turn into new revenue on any short, predictable timeline. They turn into revenue over one to three years, depending on the asset.
The Acquisition Engine
Acquisitions aren't incidental to Park's story — they're central to it. As of H1 FY26, acquired hospitals accounted for more than half of both revenue and EBITDA, according to the company's IPO prospectus, which tells you how load-bearing this part of the model actually is.For Park, acquisitions function less like opportunistic bolt-ons and more like a capital-allocation strategy in their own right. The investment case for each one rests on three variables: the acquisition price, the speed of operational integration, and the time required to reach normalized occupancy. Management has referenced screening 50-60 potential targets historically before settling on the roughly one-third of the current network that came in through acquisition, evaluated against location, regional disease burden, existing infrastructure, headroom to expand, and — for distressed brownfield assets specifically — how much financial trouble the seller is in, since that distress is usually what makes a deep-discount purchase possible.
Once a target is picked, management from mature, existing hospitals — trained for roughly six to eight months, according to Q1 FY'27 commentary — gets moved into the new unit to replicate Park's SOPs and clinical protocols rather than inheriting whatever systems came with the asset.
The brownfield model can offer attractive returns when Park buys existing infrastructure at a discount and rapidly lifts utilization — management says some acquisitions have turned EBITDA-positive, even PAT-positive, within the first operating month. But repeated acquisitions also raise integration risk, and historical success may become a less reliable guide as the geographic footprint gets more complex — Uttarakhand and Uttar Pradesh, in particular, are markets where Park has comparatively little operating history to draw on.
Growth Runway: The Bed Count Story
Park's operating capacity stood at roughly 3,250 beds as of March 2026 (per the Q4/FY26 concall, dated May 13, 2026), climbing to about 3,960 beds by the June 2026 quarter-end after the Panchkula greenfield commissioning, according to management on the Q1 FY'27 call. Management's latest roadmap targets:
~4,290 beds by the end of Q2 FY'27 (H1 FY27), driven largely by the Rudrapur (Uttarakhand) acquisition, commissioned August 2, 2026, according to management
~4,740 beds by the end of FY'27 (March 2027), adding roughly 450 beds through a Palam Vihar (Gurgaon) extension and the Zirakpur (Mehar Hospital) acquisition
~5,740 beds by the end of FY'28 (March 2028), via another roughly 1,000 beds spread across a Gorakhpur facility, an Ambala oncology-dedicated extension, a Mohali expansion, and a Rohtak greenfield project
Management has said this expansion is meant to be funded "largely through internal accruals and IPO proceeds, without recourse to any fresh debt" — a claim the balance sheet at least partly supports, as covered below. Hospitals require significant capital to build, acquire and expand capacity, so understanding the economics of capital-intensive businesses is important when evaluating this growth strategy. Read Capital-Intensive Businesses Explained: Risks, Economics, and Investor Insights for a deeper framework.
Two expansion themes stand out. The Uttar Pradesh push — starting from essentially zero presence before the Agra acquisition (commissioned mid-February 2026) — targets close to 1,060 beds in UP by FY'28, anchored around Agra, a planned Kanpur facility, and Gorakhpur. It's a genuinely large bet in a market where Park has almost no track record. Separately, the Tricity densification around Chandigarh-Mohali-Panchkula — helped along by the Panchkula commissioning, an ongoing Mohali expansion, and the Zirakpur acquisition — is intended, per management, to make Park the single largest private healthcare provider in that catchment.Two further tailwinds sit alongside the bed count: the CGHS rate revision (a roughly 12-15% central-government tariff hike announced in October 2025), with management guiding to a conservative 7-7.5% net revenue benefit for FY'27 as it flows through gradually; and ARPOB growth guidance of 10-12% annually, tied to the ongoing shift toward higher-acuity specialties.
The Critical Question: Can Occupancy Catch Up?
The question that matters most here isn't whether Park can add beds. It clearly can, and has, at a pace few peers are matching. The question is whether it can fill them fast enough.Network occupancy in Q1 FY '27 stood at 56%, according to management, down from 68% in the same quarter a year earlier — a direct consequence of roughly 960 beds (Bathinda, Agra, and Panchkula) entering the denominator faster than they've ramped up patient volumes. Management has guided that full-year FY '27 occupancy will moderate further from FY26's 64%, given the scale of capacity being added through calendar 2026.This makes occupancy the single most important operating variable to track over the next six to eight quarters. If occupancy recovers while ARPOB continues compounding at the guided 10-12%, Park should start showing real operating leverage — the kind where revenue grows faster than costs. If bed capacity continues to outrun patient-volume growth, however, returns on the incremental capital being deployed could stay subdued for longer than the bed-count trajectory alone would suggest.
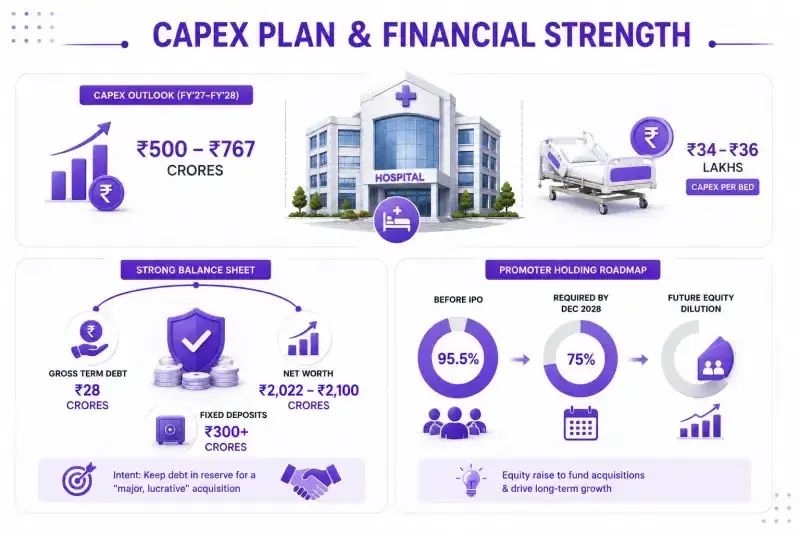
The Pipeline and How It's Being Funded
Putting numbers on the plan: management has guided to roughly ₹500-767 crores of capex across FY'27-FY'28 combined (the figure has moved around a bit call to call, but stayed in that broad range), which works out to a blended capex per bed of ₹34-36 lakhs — in line with the company's usual discipline on this metric.
On funding, the company had, as of March 2026, gross term debt of just ₹28 crores against a net worth of roughly ₹2,022-2,100 crores and fixed deposits north of ₹300 crores — a genuinely lightly-levered balance sheet for a company in the middle of an expansion this size. Management's stated intent is to keep it that way, holding debt in reserve for a "major, lucrative" acquisition rather than using it as routine growth funding.
One item worth flagging for anyone tracking the equity side of this story: promoter holding stood at roughly 95.5% before the IPO, and SEBI's minimum public shareholding rules require that to come down to 75% within three years of listing — a deadline management has pegged at December 2028. As of the January 2026 call, management called it "too early to comment" on timing, which means some further equity dilution is likely somewhere in the outlook window, even though management frames the eventual raise as an opportunity to fund acquisitions rather than a forced sale.
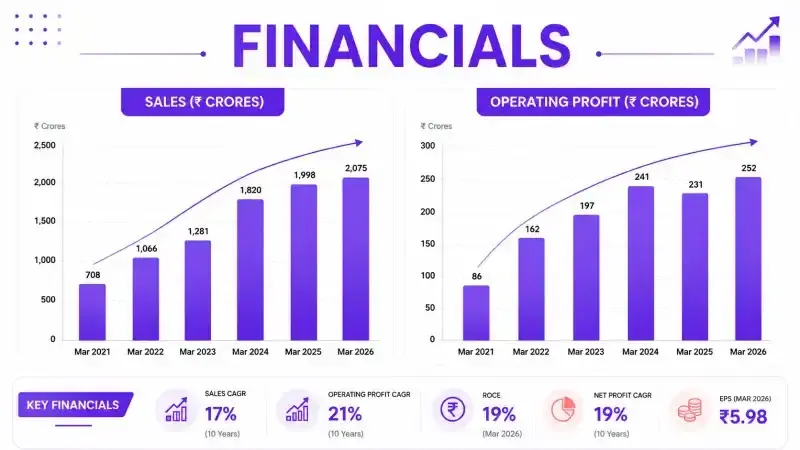
Park Medi World Financial Performance
Revenue and profitability (annual, consolidated). Sales grew from ₹766 crores in FY21 to ₹1,679 crores in FY26 — a compounded growth rate of roughly 17% over the trailing five years. Operating margin compressed over that stretch, from 40% in FY21 to 26% in FY26, consistent with a smaller, more mature, higher-occupancy network in FY21 gradually absorbing a wave of new and still-ramping capacity. Net profit rose from ₹187 crores to ₹274 crores over the same period. Trailing twelve months (TTM) sales stood at roughly ₹1,752 crores.Quarterly trajectory. Quarter by quarter, sales climbed from ₹348 crores in December 2024 to ₹476 crores in June 2026 (Q1 FY'27), with operating margin bouncing in a 24-28% band and net profit rising from ₹46 crores to ₹89 crores over that run. The June 2026 quarter's 26% operating margin and ₹89 crore net profit line up with what management reported on the Q1 FY'27 call.
Returns and capital efficiency. ROCE has been sliding — from 38% in FY22 to 19% in FY26 — largely because the equity base swelled post-IPO (reserves jumped from ₹993 crores in FY25 to ₹1,936 crores in FY26) faster than returns could catch up on freshly deployed capital. That's a fairly ordinary pattern for a company that just raised primary capital mid-expansion, but it's a real number worth tracking rather than a cosmetic one.
Working capital and receivables. Debtor days moved from 151 in FY21 to 168 in FY23, back to 151 in FY24, up again to 161 in FY25, then down sharply to 129 in FY26. Management credits the FY26 improvement to faster government-side claim processing and has guided toward a medium-term target of 125-130 days. The cash conversion cycle, however, swings hard enough to warrant caution — 21 days in FY24, spiking to 161 days in FY25, then flipping to -2 days in FY26. That's a large enough jump that it reads as noisy rather than trend-worthy on its own; it's plausible this reflects some mix of payables timing and the receivables provisioning management has referenced (the company cites a roughly 8-9% claims disallowance rate as fairly standard for the industry).
Quality of earnings. Earnings quality is worth judging alongside cash generation, not PAT growth alone. FY26 operating cash flow of ₹329 crores exceeded reported PAT of ₹274 crores, which is a reassuring sign, but the business remains working-capital intensive given its heavy government-payer exposure. Investors are probably better served tracking CFO-to-PAT and debtor days together, quarter over quarter, than leaning on PAT growth in isolation.This is why cash generation deserves as much attention as reported profit. If you want to understand how investors use operating cash flow to assess earnings quality, read Cash Flow Statement Explained: The Most Honest Financial Report.
Cash flow and balance sheet. Operating cash flow has been volatile but broadly positive — ₹223 crores in FY21 to ₹329 crores in FY26, dipping to ₹191 crores in FY25 along the way. Investing outflows scaled up to -₹333 crores in FY26, in line with the acquisition and expansion spree underway. Free cash flow swung from ₹299 crores in FY24 down to ₹66 crores in FY25 before recovering to ₹209 crores in FY26. Total assets nearly doubled, from ₹1,593 crores in FY23 to ₹2,813 crores in FY26, while borrowings actually fell from ₹687 crores in FY24 to ₹364 crores in FY26 even as the asset base grew — consistent with IPO proceeds being used partly for deleveraging (management has referenced roughly ₹380 crores of the fresh issue earmarked for debt repayment).
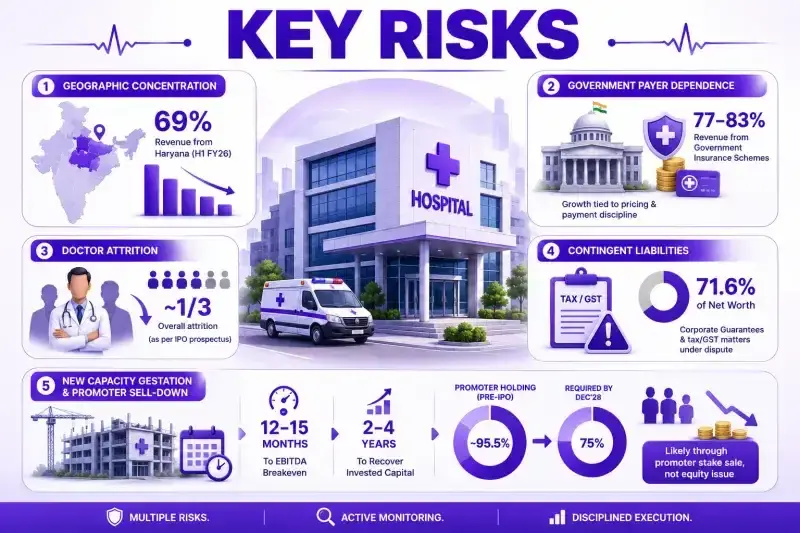
Key Risks
“The essence of investment management is the management of risks, not the management of returns.” — Benjamin Graham
Geographic concentration in Haryana. Even as Park pushes into Uttarakhand, Punjab, and Uttar Pradesh, Haryana still contributed 69% of revenue in H1 FY26, per the company's own prospectus — down from 73-84% across the three years before that. A real de-risking trend, but the base remains concentrated enough that regional disruption would matter disproportionately.
Government payer dependence. With roughly 77-83% of revenue coming from government insurance schemes (the figure moves somewhat depending on the period and source), Park's growth is tightly tied to the pricing and payment discipline of central and state government bodies — which is also why the company has, in the past, had to temporarily scale back operations at specific sites (Karnal, per the IPO prospectus) due to payment delays.
Doctor attrition. The gap between the consultant-level attrition management cites and the roughly one-third total attrition the IPO prospectus disclosed is worth tracking, particularly as the company scales headcount into unfamiliar territory like Uttarakhand and Uttar Pradesh. Contingent liabilities and corporate guarantees. As of the IPO prospectus cut-off (September 2025), corporate guarantees stood at roughly 71.6% of net worth, alongside various tax and GST matters under dispute — not crystallized losses, but a real overhang worth watching.
New-capacity gestation and promoter sell-down. Greenfield hospitals can take 12-15 months just to reach EBITDA breakeven, and considerably longer to recover invested capital — a meaningful chunk of the network will be somewhere in this ramp at any given time over the next two years. Separately, promoter holding stood at roughly 95.5% before the IPO, and SEBI's minimum public-shareholding norms require this to move toward 75% by December 2028. Management was non-committal on timing as of the January 2026 call. Worth noting: this reduction is likely to come through a promoter stake sale rather than a fresh equity issue, so it's better understood as a potential supply overhang from promoter sell-down than as mandatory dilution of existing shareholders.
Conclusion
“Price is what you pay. Value is what you get.” — Warren Buffett
At its core, Park Medi World is a bet on a contrarian idea in Indian healthcare — that a hospital chain can grow profitably by chasing volume and geography instead of premium pricing, provided it keeps capital discipline tight and its operating playbook repeatable.
The company has already built a meaningful base. Revenue has grown from ₹766 crore in FY21 to ₹1,679 crore in FY26, while PAT increased from ₹187 crore to ₹274 crore. At the same time, the company has expanded its bed capacity rapidly and maintained a relatively lightly leveraged balance sheet. The next phase, however, is where the model really gets tested.
Management is targeting a bed count of 4,290, then 4,740 and eventually 5,740 by FY28. Whether that expansion creates value will depend less on the number of beds added and more on what happens after those beds come online. Occupancy was around 56% in Q1 FY27, according to management, so the direction over the next 6–8 quarters will be important. ARPOB stood at ₹30,444 in Q1 FY27, and the company is guiding for 10–12% annual growth. If that guidance holds alongside improving occupancy, the combination could provide a meaningful earnings boost.
The payer mix is another important part of the story. Government schemes accounted for around 77% of revenue in Q1 FY27, with management targeting a move toward 70:30. A gradual shift in this direction, together with the expected CGHS benefit, could improve the quality of revenue and potentially help ARPOB and collections.
But growth alone will not be enough. ROCE was 19% in FY26 according to Screener, down from 38% in FY22, so the ability of the new hospitals and acquisitions to generate attractive returns on incremental capital will matter considerably. Debtor days improved to 129 in FY26, but the cash conversion cycle has been much more volatile. That makes working capital something worth watching rather than assuming the recent improvement is permanent. Working capital is only one part of measuring how efficiently a company uses shareholders’ capital. To understand another key return metric investors use alongside ROCE, read Return on Equity (ROE) Explained: A Step-by-Step Guide for Investors.
The same applies to acquisitions. Acquired hospitals already make up a significant portion of Park's revenue and EBITDA, so the company's ability to keep integrating new facilities successfully will become increasingly important as it expands into markets such as Uttar Pradesh and Uttarakhand.
Ultimately, Park's investment case rests on a fairly simple chain: can the company turn a rapidly expanding bed base into occupied beds, occupied beds into higher ARPOB, and higher revenue into attractive returns on incremental capital?
If occupancy improves, ARPOB continues to compound, acquisitions integrate well, debtor days remain under control and cash generation keeps pace with reported earnings, the expansion could support a meaningfully larger earnings base by FY28. If capacity keeps growing faster than utilisation, however, revenue growth could come at the expense of ROCE and free cash flow. So the most important thing to watch is not simply how fast Park Medi World grows, but how efficiently it grows.
Explore our Products
Research Framework

Emerging Titans
Combination of quantitative analysis, industry tailwinds, and management assessment - SPRINT investment philosophy

Tiny Titans
Heavy emphasis on scuttlebutt research, plant visits, and early on-ground signals
FAQs
What is the core business model of the hospital chain?
+The company follows an affordable healthcare model built around high patient volumes, disciplined costs and relatively low capex per bed. Instead of relying primarily on premium pricing, it aims to improve profitability through occupancy, scale, higher-acuity specialties and operational standardisation.
How is the company planning to expand its hospital network?
+Growth is primarily coming through a combination of greenfield hospitals, brownfield acquisitions and hospital expansions. Management has outlined a roadmap from roughly 3,960 operational beds in June 2026 toward about 4,740 beds by FY27 and 5,740 beds by FY28, with major expansion planned across Uttar Pradesh, Uttarakhand and the Chandigarh-Mohali-Panchkula region.
Why are acquisitions important to the company's growth strategy?
+Acquisitions allow the company to take over already-built or distressed hospital assets at potentially lower capital costs than constructing entirely new facilities. The company then applies its own management systems, clinical protocols and operating processes to improve utilisation and profitability.
What are the biggest risks facing the business?
+The major risks include high dependence on government healthcare schemes, geographic concentration, doctor attrition, acquisition-integration challenges, contingent liabilities and the long gestation period for new hospitals. Government schemes accounted for roughly 77% of revenue in the June 2026 quarter, making reimbursement rates and payment cycles particularly important
What should investors watch going forward?
+Key indicators include bed additions and occupancy, the shift toward private-payer revenue, ARPOB growth, debtor days and cash conversion, the impact of revised CGHS rates, doctor attrition and promoter stake dilution. The ability to execute the planned expansion while maintaining capital discipline will be central to whether the growth thesis plays out.

High growth stock specialist, Value Educator
Shashank Mahajan is an equity research professional with over 12 years of experience in identifying high-potential SME and micro-cap stocks at an early stage. He follows a rigorous scuttlebutt research–driven approach, combining on-ground insights with deep financial analysis. Shashank specializes in uncovering under-researched and under-owned companies with strong management quality and long-term growth potential. Through disciplined research and early identification, he focuses on spotting tomorrow’s market leaders before they enter the mainstream investor radar.
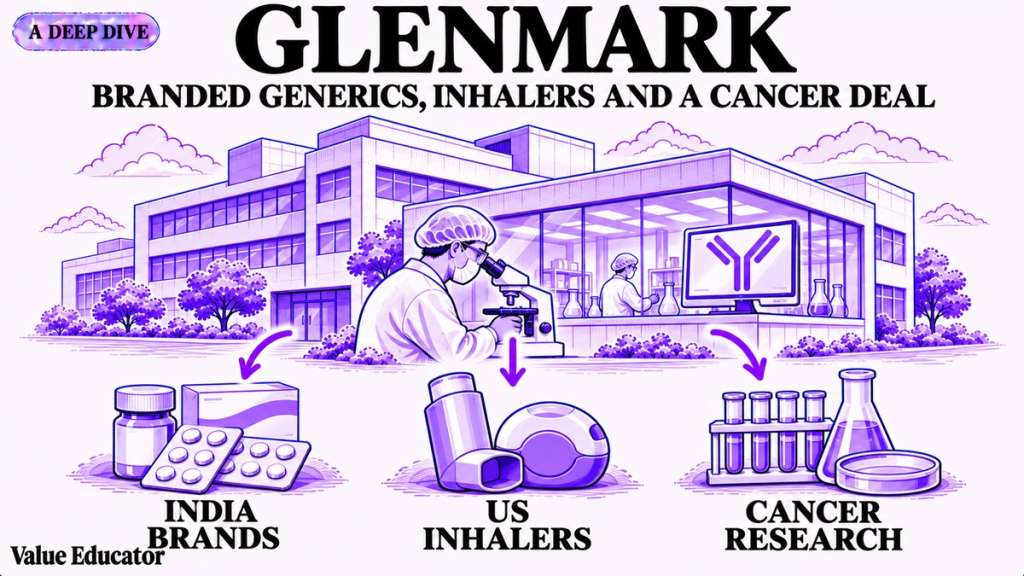
Glenmark: The USD 700 Mn Cancer Deal and Its Brands
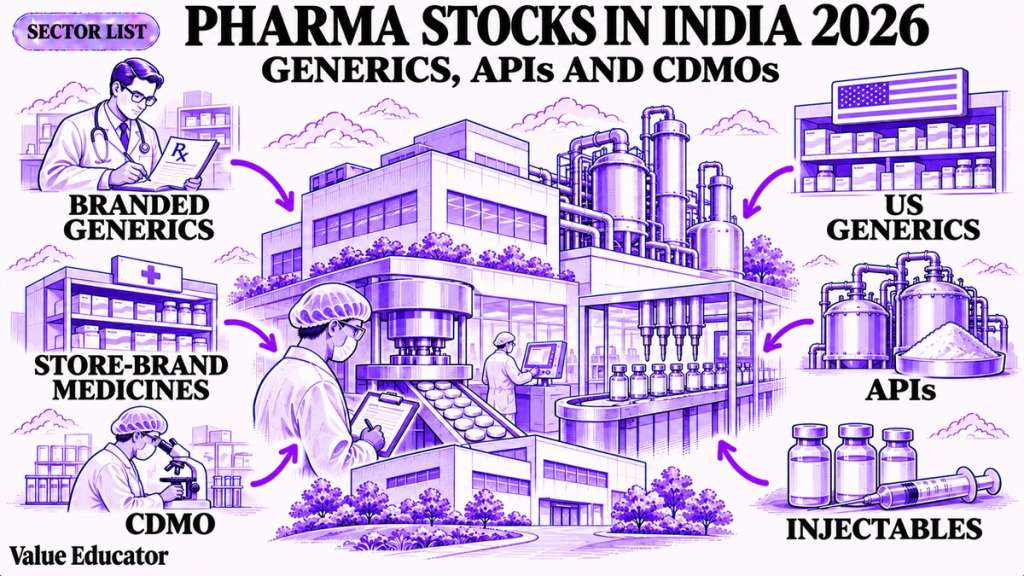
Pharma Stocks in India 2026: Generics, APIs and CDMOs
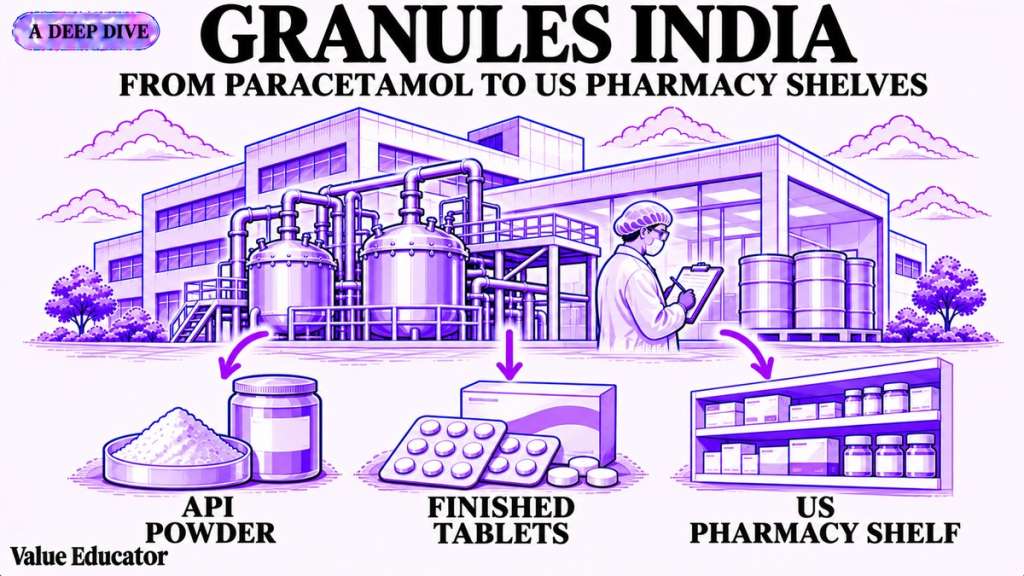
Granules India: From Paracetamol to a 65% Gross Margin
Natco Pharma: After Revlimid, 29 Patent Challenges
Shilpa Medicare: Cancer APIs, Films and Biosimilars

Alembic Pharma: US Plants Pay Back, Margin Hits 22.2%
Explore our Products
Research Framework
Emerging Titans
Combination of quantitative analysis, industry tailwinds, and management assessment - SPRINT investment philosophy
Tiny Titans
Heavy emphasis on scuttlebutt research, plant visits, and early on-ground signals



Modern Warfare to Multibaggers
Key Trends. Strategic Shifts. Opportunities Ahead.
Today at 7:00 PM IST. Room opens 30 minutes before.
Don't Miss This Exclusive Webinar!
Join Value Educator to decode the key trends shaping India's defence sector and learn how to identify tomorrow's potential leaders in the space.
- In-depth research on India's defence sector
- Live Q&A session
- Actionable takeaways for long-term investors

 Orders
 Subscription
 Share with friends


Required Details
₹23999.00
(12 month subscription)
As per SEBI regulations, all users are mandated to complete the KYC that is validated for 1 year. Post payment, you will be redirected to the KYC screen


No comments yet. Be the first to comment!