
Segment-Wise Revenue Analysis Explained

In the FY 2023-24, TCS has shown a revenue of more than ₹2.4 lakh crores. This itself gives us an immediate feel of the scale and consistency that the company has been able to achieve. For most investors, this is the first number that they look at, and it becomes the point of departure for all further analysis.

“Accounting is the language of business.” - Warren Buffett
However, this figure itself gives us an idea of the size of the company, but does not, in any way, give us an idea of how this revenue is generated. Is the company growing at the same pace in all sectors, or is it relying more on some sectors than what we might think? Is the company’s performance uniform across all sectors, or is one sector silently driving the performance?
These are questions that are not necessarily raised when we look at the consolidated statements. However, the answers to these questions can give us a completely different perspective on risk, resilience, and growth. Segment-wise analysis of revenue can bridge this gap by looking beyond the top line to see the structure that actually fuels the performance of the business.
Segment Revenue: Looking Beneath the Surface
When the results are announced, the first figure that emerges, which is likely to draw attention, is the total revenue. It gives a quick glimpse into scale, but it does not necessarily give an insight into what is happening beneath the surface. However, this one number is actually just a compilation. Behind this number is a combination of different types of businesses, markets, and revenue streams that are not necessarily going in the same direction.
“You don’t have to know everything about a company — but you must know what really drives it.” - Peter Lynch
The analysis of revenue for each segment of a company is actually just the process of dissecting this one number into its separate components. Rather than viewing the company as a whole, this analysis enables investors to see how different segments of the company contribute to growth and how each segment of the company performs under different scenarios.
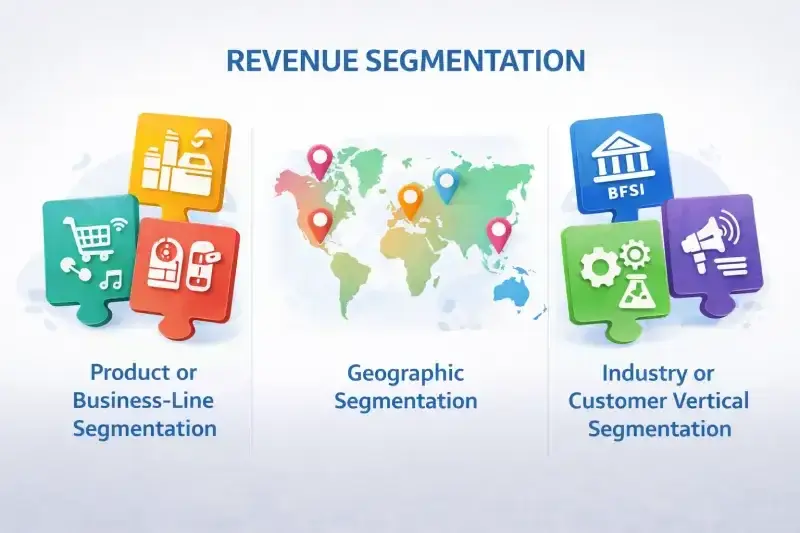
A business segment is a separate portion of a company that can be analyzed independently. These segments are usually defined based on how management runs the organisation internally, how teams are structured, how performance is tracked, and where strategic focus is placed. Looking at revenue this way helps investors move beyond aggregated results and see what’s actually happening beneath the surface.
Companies organise their segments differently depending on their operations, but most disclosures tend to fall into a few broad categories.
Product or Business-Line Segmentation
Some companies divide revenue according to different business lines or operating divisions, particularly when they operate across multiple industries.
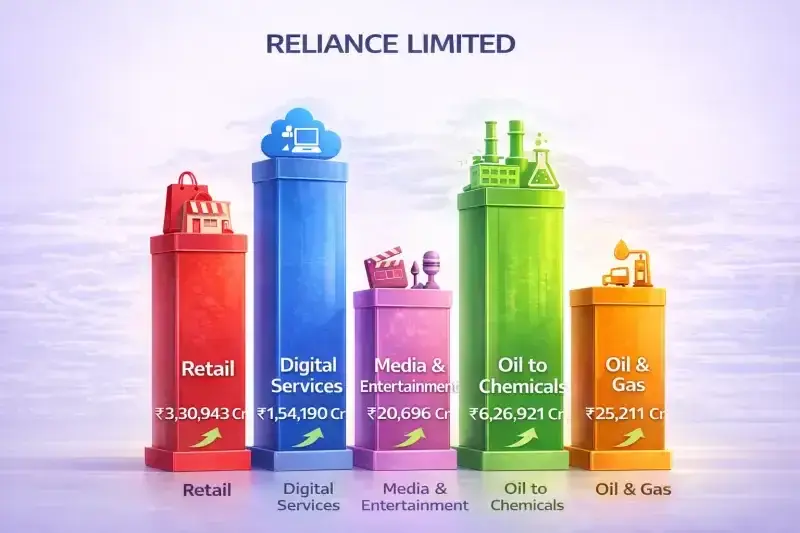
Reliance Industries is a good example. Rather than functioning as a single business, it reports performance across segments such as Oil-to-Chemicals, Digital Services, Retail, Media & Entertainment, and Oil & Gas. Each of these sectors is driven by different economic forces and growth patterns.
By looking at revenue in this way, investors can see whether growth is driven by traditional energy businesses, growing consumer-facing enterprises, or new digital platforms, which is not possible by looking at consolidated revenue.
Geographic Segmentation
Global companies may also segment their revenue based on regions. This is because the market conditions, economic cycles, and demands of different regions tend to be quite different.
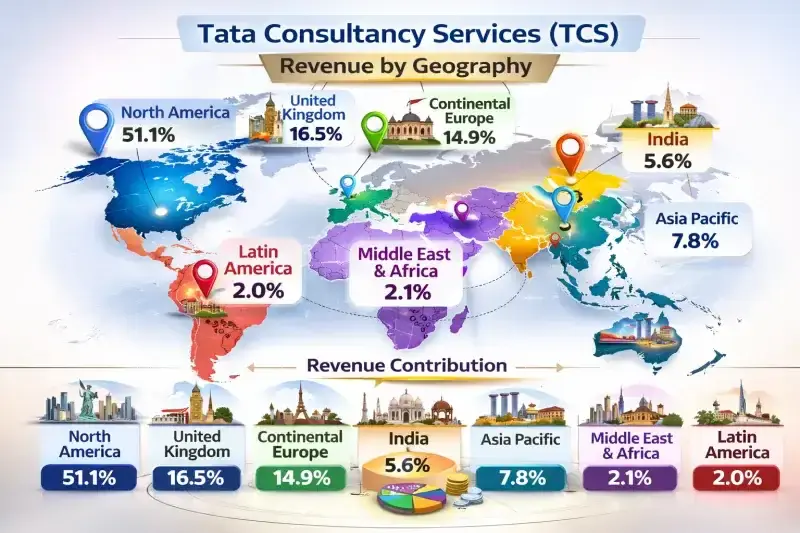
TCS is a good example of a company that segments its revenue based on geographic regions, including North America, the United Kingdom, Continental Europe, India, Asia Pacific, Middle East and Africa and Latin America. This is because technology spending is not the same in all markets.
By breaking down the revenue into segments based on geography, it is easy to determine where the revenue growth is and where the revenue might be exposed to a potential slowdown in a given geography.
Industry or Customer Vertical Segmentation
Industries like information technology (IT) service provide revenue breakouts by industry type and/or client types.
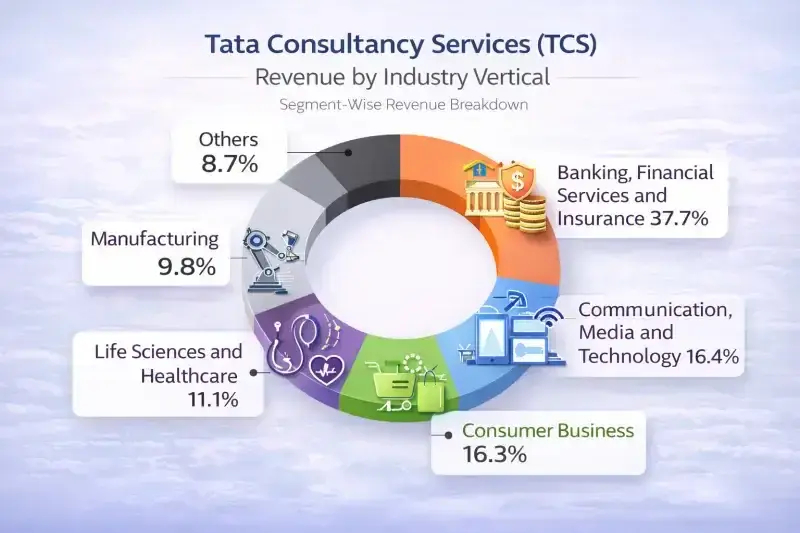
An example of this breakdown is TCS's breakdown of revenue streams into verticals, which are Banking, Financial Services & Insurance (BFSI), Communication, Media and Technology, Consumer Business, Manufacturing and Life Sciences and Healthcare. Each of these industries has its own demand cycle, and hence the performance of the company may differ based on the trends in these industries.
Segment reporting is more than a compliance requirement; it is also a reflection of the way the company is actually run. Investors who analyze revenue through a product-specific, geographic or industry specific lens will gain insights into how a company operates and what makes it tick; this is an especially helpful approach when assessing conglomerates, which are multiple business segments that all fall under the same company.
For investors who want to go deeper, segment disclosures are usually found in the notes to accounts — an area often overlooked but critical for serious analysis.
Understanding how to read those disclosures properly is covered in detail in How to Read a Balance Sheet Like a Professional Investor.
But before segment reporting, it is important to understand how the revenue is segmented. The real value, however, is in understanding why this segmentation is important and how it alters the investor’s perspective on growth, risk, and opportunity.
Beyond Consolidated Revenue: Why Segment Analysis Changes the Investment Lens
Looking at consolidated revenue tells us how large a company is, but it rarely explains what is truly driving its performance. Segment analysis helps investors move beyond the surface and understand where growth actually originates.
Rather than looking at the business as a whole, segmenting the revenue helps to identify which areas of the business are growing, which areas are stagnating, and which areas are influencing the business in the background.
Finding the True Growth Engine
Not all parts of a business grow at the same pace. The greatest momentum for a company could be found in a particular segment, as opposed to the company as a whole. By finding the growth engine, investors can see what is driving the company and if this momentum is sustainable.
This approach becomes even more powerful when combined with a structured evaluation framework, such as outlined in A Fundamental Checklist: How to Research a Stock in 1 Hour.
Identifying Structural Shifts
Over time, companies evolve. New segments are created, existing divisions grow older, and the revenue base shifts over time. Segment analysis enables investors to observe these changes early on whether a company is evolving into new spaces, de-emphasizing older businesses, or reinventing itself altogether.
Understanding Strategic Direction
Management strategies often become visible first through segment performance. Investments in new technologies, entering new regions, or focusing on higher-margin products would typically appear in the breakdown of the segments before they are reflected in the consolidated financials. Segment analysis is useful for investors to determine if the stories are being realized.
Evaluating Risk Concentration
On the surface, a firm may be diversified, but a large part of its revenue may be driven by one industry, geography, or product group. This is where the concept of segment analysis becomes important. It helps investors understand the risk of a firm if the economy changes.
Concentrated revenue exposure often increases vulnerability during downturns, which is why understanding cycles matters — explained further in Bull Market vs Bear Market – How Investors Should React.
Comparing Quality of Growth
Growth is more than just the amount of revenue growth, but also the source of the growth. Certain sources of growth may have better margins, scalability, or demand stability than others. This is important for investors to understand in order to assess whether the growth is enhancing the resilience of the business or just adding more volume without value.
Ultimately, segment-wise analysis alters the way in which investors view financial results. Rather than focusing on the numbers, segment-wise analysis offers insight into the underlying forces that influence resilience, opportunity, and future potential.
Understanding segment disclosures becomes clearer when applied to a real company. But segment revenue is just one part of the picture — combining it with balance sheet strength and cash flow analysis gives a more complete view of business quality.
Let’s look at Tata Motors, where analysing revenue by segment helps reveal how different parts of the business contribute to growth and risk.
Breaking Down Tata Motors: Identifying the Real Drivers of Growth
Tata Motors reported consolidated revenue of ₹4,39,695 crore for the financial year 2024-2025. On the surface, that number signals scale. But that figure combines very different businesses, and each one behaved differently during the year.
“The important thing is to understand the business, not just the stock.” - Charlie Munger
To understand what’s actually happening, we need to see how each segment contributed.
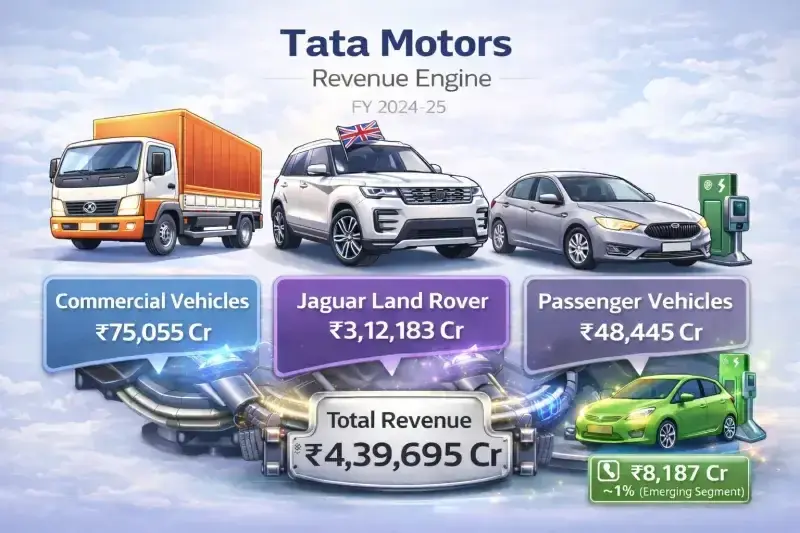
Commercial Vehicles: Stable, but not accelerating
The Commercial Vehicles business reported a revenue of ₹75,055 crore for the year.
On the face of it, that is quite robust, but the key point here is not the acceleration in growth but the stability. This particular business is known to move in sync with the overall economy. This is why understanding industry cycles becomes essential when analysing such segments, especially in businesses that are closely linked to economic activity.
When the freight scenario or the infrastructure development scenario improves, naturally, the demand will go up. And when the environment turns a little softer, the effect is felt in this area quite quickly.
The margins have expanded, and that is a sign of better control over costs. However, this particular business is not known to change the overall growth narrative of the company. It is more of a stable anchor.
Passenger Vehicles: Growing, but still balancing profitability
The Passenger Vehicles segment brought in ₹48,445 crore in revenue during the year.
There’s clear progress here. The company has been able to strengthen its position in the domestic market, and new models have ensured that demand levels remain steady. It is quite apparent that the company is moving ahead and attempting to increase its presence.
At the same time, profitability tells a more measured story. The margins are still relatively lower compared to other segments. This is an indication that the growth of this business is being fueled by investment, pricing, and expansion rather than just pricing power.
It is often helpful to look at the operating margins in conjunction with the revenue growth.
So while Passenger Vehicles adds meaningfully to the overall revenue base, it appears to be in a phase of building and strengthening — not yet one where it dominates in terms of profitability.
Electric Vehicles: Small in size, big in signal
EV revenue stood at ₹8,187 crore, with over 64,000 units sold.
In absolute terms, EV is smaller compared to Commercial Vehicles or Jaguar Land Rover. But percentage growth and market share leadership tell a different story.
EV does not yet dominate revenue. But it signals structural change. It represents a shift in future revenue mix, not today’s largest contributor, but potentially tomorrow’s strategic driver. If this shift sustains over time, it may eventually influence the company’s long-term competitive positioning.
It is not the current engine. It is the emerging one.
Jaguar Land Rover: The segment that moves the needle
Jaguar Land Rover reported revenue of £28,961 million — roughly ₹3,12,183 crore — making it the largest contributor to Tata Motors’ consolidated revenue.
When one segment carries this much weight, even relatively small changes in its performance tend to ripple through the overall numbers. In simple terms, what happens within JLR often shapes how the company’s performance looks at the consolidated level.
This is also why investors study earnings quality and valuation carefully when a single segment dominates — something explored in The P/E Ratio Decoded: Trailing vs. Forward, and What is a "Good" P/E?.
Jaguar Land Rover is also generating relatively stronger margins and free cash flow compared to the domestic operations. This is not only important from a revenue perspective but also from an overall profitability perspective.
Coming to the current year, Jaguar Land Rover has the maximum weightage (71%) in determining the overall performance of Tata Motors’ consolidated performance.
“Risk comes from not knowing what you’re doing.” - Warren Buffett
What is actually happening?
When we piece all this together, the overall picture emerges:
- Commercial Vehicles add stability.
- Passenger Vehicles add domestic expansion.
- Electric Vehicles add future direction.
- Jaguar Land Rover adds scale and consolidated impact.
The segment contributing the most to revenue today is Jaguar Land Rover.
The segment showing structural long-term transformation is Electric Vehicles.
The domestic segments provide diversification but are more cyclical.
That is the real value of segment-wise revenue analysis.
It doesn’t label one winner.
It explains who drives the current and who can shape the future.
Although segment analysis helps to gain more insight into the drivers of performance, it is also necessary to acknowledge the limitations and subtleties that may not be fully reflected by segment disclosures.
Understanding the Limits of Segment Analysis
Segment-wise analysis helps to focus, but it does not remove complexity. Like all other tools of analysis, it throws light on some aspects of performance and keeps other aspects in the background. It is important to keep these points in mind to avoid strong interpretations based on segment-wise analysis.
Segments Can Be Broad and Simplified
Companies define segments based on internal reporting structures, which means a single segment may include multiple underlying businesses. These sub-areas may operate under different growth drivers or margin profiles, yet appear as one combined number. This can sometimes mask shifts happening within the segment itself.
Cost Allocation Can Influence Profitability
Segment profitability depends on how costs are assigned internally. For shared costs such as corporate expenses, R&D, or shared services, accounting allocations may not accurately represent economic reality. Therefore, the segment margins should be considered indicative rather than absolute.
Fast Growth Does Not Always Mean High Impact
A smaller segment that is growing rapidly may look attractive, but if the overall contribution of that segment to the revenue is small, then the impact of that segment on the consolidated performance may not be significant.
Cyclical Trends Can Distort Short-Term Conclusions
Some segments are naturally cyclical in nature. A strong year may simply be a result of industry conditions, and a weak year may not necessarily be a sign of a downtrend.
External Factors Can Skew Segment Performance
Segments don’t operate in isolation. Currency movements, policy changes, or shifts in global demand can lift or pressure one segment more than another. If these factors aren’t considered, performance may appear better or worse than it actually is from an operational standpoint.
Strategic Importance and Current Contribution May Differ
A segment contributing less revenue today may still be strategically important for future growth. Segment analysis reflects current structure, not necessarily where the business is heading next.
Seen together, these insights and constraints help frame how segment analysis should actually be used.
Seeing Beyond the Numbers: The Real Value of Segment Analysis
“In investing, what is comfortable is rarely profitable.” - Robert Arnott
Segment-wise revenue analysis changes how we interpret financial performance. Instead of seeing a company as one single entity moving in one direction, it allows us to understand the internal dynamics that shape growth, stability, and future potential. The headline number tells us how large a business is but the segment breakdown reveals how that size is actually built, which parts are contributing the most today, and which areas may gradually reshape the company’s trajectory over time.
As seen through the Tata Motors example, different segments can play very different roles simultaneously. One may provide stability, another may drive scale, and a smaller emerging segment may signal long-term transformation. The objective is not to declare a permanent “winner,” but to recognise how contribution, momentum, and strategic importance can shift across cycles. When used thoughtfully, segment analysis helps investors move beyond surface-level interpretation and develop a clearer understanding of risk concentration, quality of growth, and evolving business structure.
To take this further and evaluate how growth drivers translate into long-term wealth creation, read Beyond Revenue Growth: 10 Mid-Cap Stocks Where Profits Compound.
If this way of analysing companies changed how you look at financial results, let us know, comment “SEGMENT” below and share how you identify a company’s growth drivers when reviewing financial statements.
Explore our Products
Research Framework

Emerging Titans
Combination of quantitative analysis, industry tailwinds, and management assessment - SPRINT investment philosophy

Tiny Titans
Heavy emphasis on scuttlebutt research, plant visits, and early on-ground signals
FAQs ( Frequently Asked Questions )
Why is segment-wise revenue analysis important?
+Because consolidated revenue shows overall performance but does not explain which business areas are driving growth, stability, or risk.
Does the largest segment always represent the growth engine?
+Not necessarily. A segment may dominate revenue due to size, while another smaller segment may show faster growth or strategic importance.
Can segment profitability be misleading?
+Yes. Cost allocation and internal accounting practices can affect how margins appear at the segment level, so profitability should be viewed directionally rather than absolutely.
How often should investors review segment disclosures?
+Ideally every quarter or annual report cycle, especially when companies discuss strategic shifts, new investments, or changing business focus.
What is the biggest mistake when analysing segments?
+Focusing only on percentage growth without considering absolute contribution or broader economic context.

High growth stock specialist, Value Educator
Shashank Mahajan is an equity research professional with over 12 years of experience in identifying high-potential SME and micro-cap stocks at an early stage. He follows a rigorous scuttlebutt research–driven approach, combining on-ground insights with deep financial analysis. Shashank specializes in uncovering under-researched and under-owned companies with strong management quality and long-term growth potential. Through disciplined research and early identification, he focuses on spotting tomorrow’s market leaders before they enter the mainstream investor radar.

Glenmark: The USD 700 Mn Cancer Deal and Its Brands

Pharma Stocks in India 2026: Generics, APIs and CDMOs

Granules India: From Paracetamol to a 65% Gross Margin

Natco Pharma: After Revlimid, 29 Patent Challenges

Shilpa Medicare: Cancer APIs, Films and Biosimilars

Alembic Pharma: US Plants Pay Back, Margin Hits 22.2%
Explore our Products
Research Framework
Emerging Titans
Combination of quantitative analysis, industry tailwinds, and management assessment - SPRINT investment philosophy
Tiny Titans
Heavy emphasis on scuttlebutt research, plant visits, and early on-ground signals



Modern Warfare to Multibaggers
Key Trends. Strategic Shifts. Opportunities Ahead.
Today at 7:00 PM IST. Room opens 30 minutes before.
Don't Miss This Exclusive Webinar!
Join Value Educator to decode the key trends shaping India's defence sector and learn how to identify tomorrow's potential leaders in the space.
- In-depth research on India's defence sector
- Live Q&A session
- Actionable takeaways for long-term investors

 Orders
 Subscription
 Share with friends


Required Details
₹23999.00
(12 month subscription)
As per SEBI regulations, all users are mandated to complete the KYC that is validated for 1 year. Post payment, you will be redirected to the KYC screen


No comments yet. Be the first to comment!