
How GDP Growth Moves Earnings and Stocks
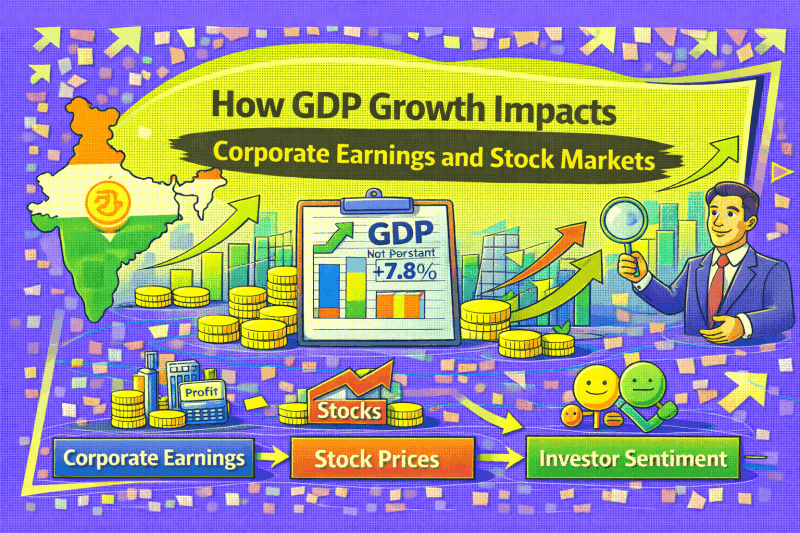
Why Your Portfolio's Future Is Written in Economic Data You're Ignoring
The Question Nobody Asked in March 2020
23rd March 2020: The Question Nobody Asked. Just before this, the Nifty had lost 38% in four weeks. For the first time in forty years, India was about to see a fall in GDP. Industries were closed and streets were empty. Economic activity came to a grinding halt.Yet within six months, the Nifty not only recovered — it hit all-time highs.
If you're new and don’t fully understand what Nifty actually represents, read: What is Nifty, Sensex & Market Indices? Beginners Guide.
Most investors still don't know why.
They remember the fear. The WhatsApp forwards. The panic selling. The crushing realization that their 'carefully researched stocks' fell just as hard as junk. However, they never posed the query that would have made all the difference:
'If the economy isn't growing, where are corporate earnings supposed to come from?'
The uncomfortable reality that investors in general tend to avoid acknowledging is that the portfolio is never really alone. It lives inside the economy. And when you ignore GDP — the national income that feeds every business in the country — you're essentially betting on magic. You're hoping corporate profits will grow even when the economy can't afford to pay for them.
This is where retail investors get destroyed.
They chase earnings growth without understanding the economic engine driving it. They buy cyclicals at GDP peaks, assuming momentum lasts forever. They panic-sell quality businesses during temporary slowdowns, not realising GDP cycles are normal. They confuse stock price movements with business fundamentals, never connecting the dots between national income and corporate profits.
If you've ever watched your portfolio collapse and thought, 'but the company was doing fine,' — this article will show you what you missed.
If you’ve ever wondered why some sectors soar while others stagnate despite similar business quality, you’re about to find out.
And if you've ever sold during a downturn only to watch the same stocks double a year later, you'll finally see the pattern you were blind to.
This isn't about becoming an economist. It's about understanding the one relationship that explains more about long-term stock returns than any other:
GDP sets the ceiling. Sectors decide direction. Companies decide winners.
1. What GDP Actually Means (And Why Nobody Explains It Properly)
Forget the Textbook Definition — Here's What GDP Really Is
GDP numbers flash on business channels. Economists debate growth rates. The finance minister announces projections. And most investors change the channel because none of it sounds relevant to picking stocks.
Here's what they should have told you:
GDP is India's national income. That's it.
Think of it as the total income earned by everyone in the country — every household, every business, every government entity — in a single year. Currently, India's GDP sits around ₹300 lakh crore. When GDP grows at 7% real + 5% inflation = 12% nominal growth, that means the country's total earning capacity increases to roughly ₹336 lakh crore the next year. This is the national income pie. Corporate revenues are a slice of it. And here's the part nobody teaches you:"If the national salary isn't growing, that slice of the pie can't keep expanding."
For instance, think about your own family budget. If your family makes an income of ₹10 lakhs per year, then your spending is limited by this amount. You can't sustainably spend ₹15 lakh without going into debt. The economy works the same way. When India's national income grows from ₹300 lakh crore to ₹336 lakh crore, there's ₹36 lakh crore more money circulating through the system. Businesses can sell more. Consumers can buy more. Banks can lend more.
But when G.D.P. is stagnant — when the national salary isn’t going up — all of those businesses have to compete for a fixed pool of money. Revenue growth is a zero-sum game. Market share gains are more important than ever. And corporate profits in the aggregate stalled.
The Circular Flow Nobody Talks About
Imagine India as one big household where everybody's expenditure is somebody else's income.The carpenter makes furniture and gets ₹50,000. He purchases vegetables from the vegetable market for ₹15,000. The vendor takes that money and buys clothes from a tailor. The tailor borrows money from a local bank to enlarge his shop. The bank invests depositor money in corporate bonds. Those corporations hire more employees. Employees spend their salaries at the kirana stores and restaurants. The cycle is continuous. What has just been described is the circular flow.
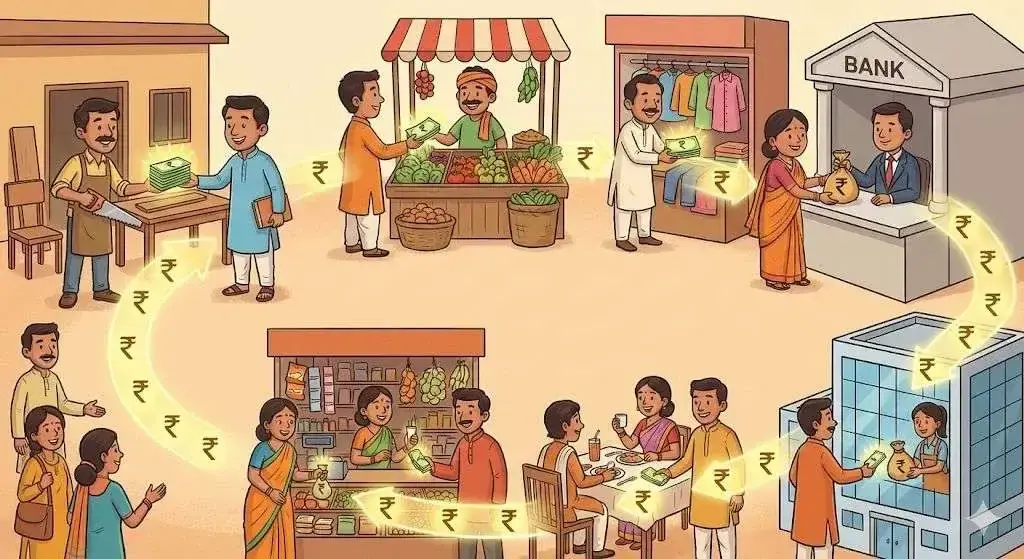
Here's the micro-story that makes it crystal clear:
When you wait to buy a car due to uncertainty about the economy, Maruti knows about it. When Maruti cuts production, its suppliers — steel companies, tyre manufacturers, component makers — feel it. When suppliers reduce orders, raw material companies feel it. When commodity companies slow down, the workers they would have hired don't get jobs. Those workers don't spend at shops. Shops don't order inventory.
The cycle tightens.
That's exactly how, cumulatively, GDP converts into earnings – decision by decision, aggregated across millions of households and thousands of businesses. Hence, the reason for not focusing on the GDP while considering the stocks is like trying to concentrate on raindrops and ignoring the monsoon altogether. You might get the raindrops right, but miss the elephant behind them.
"In the short run, the market is a voting machine. In the long run, it is a weighing machine." — Benjamin Graham
2. Why GDP Matters More in India Than You Think
The Valuation Premium You're Paying For
Indian stocks aren't cheap. They haven't been cheap for years.As of early 2026, the current price-earnings (P/E) ratio for Nifty stands at 30-40% higher compared to emerging markets; it's almost double for developed markets like the US S&P 500 when they are compared based on growth rates. Investors are paying a higher price for the shares. The question is: for what?
The answer: future GDP growth.
When global investors view India, what they essentially do is compare it with a country whose economy has been expanding at a rate of 6-8% in real terms over the past decade, with higher growth prospects in the coming decade. You compare it with economies of developed nations growing at a rate of 2-3%, or China growing at a rate of double digits but reducing now to single digits.India's growth story justifies paying 25x–30x earnings for quality businesses.
But here's what retail investors miss: That premium exists ONLY as long as GDP growth sustains. The moment growth disappoints — whether from policy mistakes, global shocks, or credit tightening — the premium compresses violently.
You don't just lose money from falling earnings. You lose money from falling multiples. The same stock trading at 30x can re-rate to 18x overnight when GDP growth expectations change.
This exact concept is explained deeply here: The P/E Ratio Decoded: Trailing vs. Forward, and What is a "Good" P/E?
This is how people lose 30% in 'quality stocks' even when earnings stay flat.
The Cycle Trap That Destroys Retail Wealth
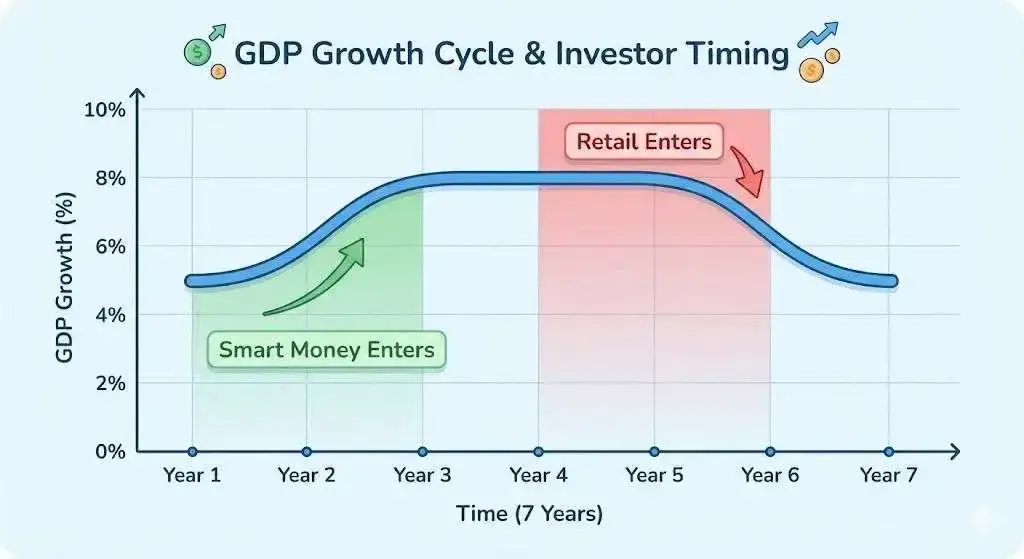
Year 1–3: GDP grows strongly at 7–8% real. Infrastructure spending booms. Corporate capex accelerates. Steel companies, cement makers, capital goods firms deliver 30–50% annual returns. Business channels run stories about India's infrastructure revolution.
Year 4: Retail investors finally notice. They read reports about India becoming a manufacturing hub. They watch YouTube videos explaining the 'capex cycle.' They buy heavily into cyclicals — convinced this time is different, convinced the boom will last forever.
Year 5: GDP growth moderates to 5–6%. Government spending slows. Private sector capex pauses. Interest rates may be rising. Suddenly, the stocks that tripled over three years correct 40–60% in months.
This is where retail gets trapped.
They entered at peak valuations, during peak GDP growth, with peak optimism. They assumed the trend would continue — because it had been continuing for years, and recency bias is powerful. Then, when the cycle turned, they held on, believing in the 'long-term story,' not realizing that GDP cycles matter more than long-term narratives in the short-to-medium term.
Meanwhile, smart investors — the ones who understood GDP cycles — had already rotated out of cyclicals into defensives. They weren't smarter. They just knew what to watch.
"Price is what you pay. Value is what you get." — Warren Buffett"Price is what you pay. Value is what you get." — Warren Buffett
3. How GDP Flows Into Stock Prices (The Mechanism Nobody Explains)
Revenue: The Direct Link You Can't Escape
Corporate revenue growth reflects nominal GDP growth. Period.
Over the last 15 years, the nominal GDP in India has increased at an 11-13% average annual rate (with a real growth rate of 6-7% and inflation at 5-6%). During the same period, combined Nifty earnings have risen at a 10-14% compound annual growth rate. While not a perfect correlation from year to year, the trend is obvious.
Why? Because corporate revenues merely represent a fraction of total economic activity. If the economy produces ₹300 lakh crore in income and expands to ₹336 lakh crore, it follows that the additional ₹36 lakh crore will be spent somewhere in the economy. Businesses making goods and services will capture part of this. Their revenues will increase proportionately. Those businesses whose revenues increase at a faster rate than the GDP growth do so temporarily:
- Market share gains: This involves taking market shares from its competitors
- Pricing power — charging more without losing customers
- TAM expansion — entering new markets or launching new products
- Formalisation — capturing share from the unorganised sector
But these advantages have limits. Competition catches up. Markets saturate. Pricing power diminishes. Sooner or later, successful businesses tend to return to the GDP growth pace unless they continue to innovate.
GDP sets the base speed limit for sustainable revenue growth.
Operating Leverage: The Profit Multiplier
Here's where GDP growth becomes really powerful — and where most investors underestimate its impact. Markets often rise 20–25% in years when GDP grows only 7–8%. The math doesn't seem to add up — until you understand operating leverage.Many business costs are fixed or semi-fixed. Factory rent doesn't double when sales double. With that, salaries don't scale linearly with revenue and also depreciation on existing assets stays constant nevertheless of capacity utilisation. When GDP-driven demand rises, companies sell more without proportionally higher costs. Revenue increases drop straight to the bottom line. A 10% revenue increase might translate to a 30% profit increase because fixed costs are being spread over higher volumes.
Real example:
A cement company is now operating at 65% capacity and it has its Fixed costs as ₹120 crore annually and variable costs as ₹55 per bag.
- Scenario 1: (weak GDP growth and demand): Equipment utilisation will continue to be at 65%. EBITDA margin: 14%. Profit: ₹140 crores.
- Scenario 2 (strong GDP growth, demand surges): Utilisation will jump to 82%. Same fixed costs. Same variable cost per unit. EBITDA margin: 22%. Profit: ₹230 crore.
Result: A 26% increase in volumes drove a 64% increase in profits.
This is why stock markets can compound faster than GDP during expansion phases — and why they collapse harder during downturns. Operating leverage works both ways.
But operating leverage works both ways. When demand declines, fixed costs remain the same, causing a sharp squeeze on profit margins — a 15% fall in revenue can lead to a 40% drop in profits.
"It's only when the tide goes out that you learn who's been swimming naked." — Warren Buffett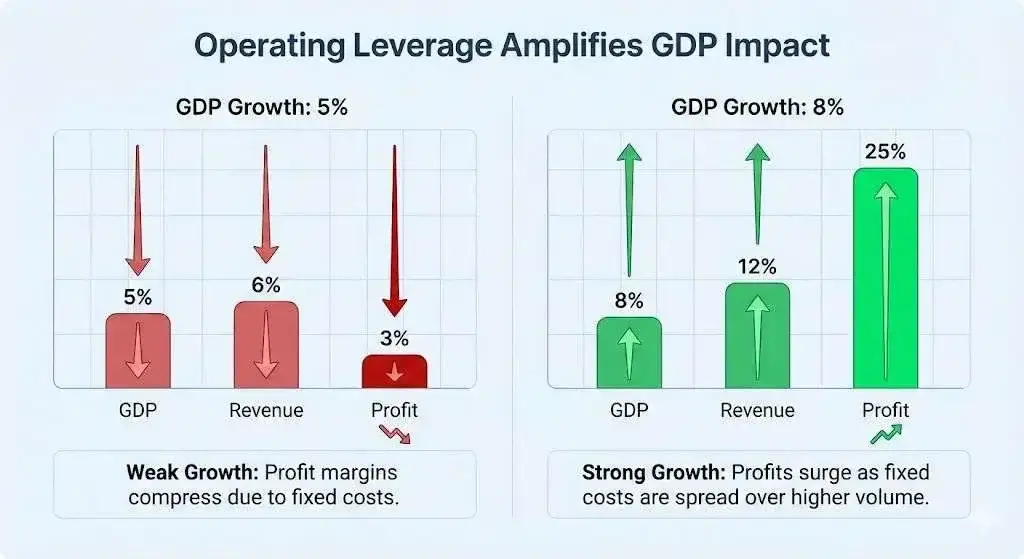
4. The Transformative Mental Model
The Three-Layer Earnings Hierarchy
This represents the total economic capacity.
- Layer 1: GDP (The Upper Limit)
This is the total economic capacity. If India's GDP is ₹300 lakh crore growing at 12% nominal, there's ₹336 lakh crore to spend next year. Not a rupee more. This sets the absolute limit for aggregate business revenues. - Layer 2: Sectors (The Direction)
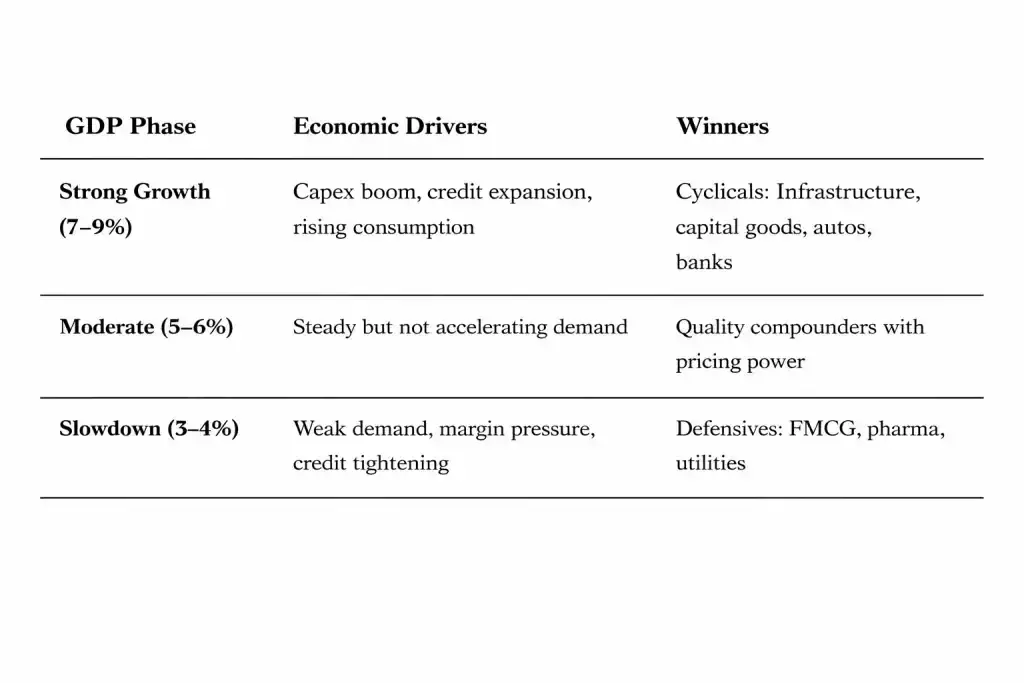
Different sectors capture different slices based on where GDP growth comes from. Investment-led growth? Capital goods and infrastructure boom. Consumption-led growth? FMCG and autos shine. Export-led growth? IT and pharma benefit. - Layer 3: Companies (The Winners)
Within favoured sectors, individual companies fight for market share. Execution quality — better products, superior distribution, operational efficiency, capital allocation — determines who wins.
This is the framework that explains almost everything:
GDP sets the ceiling. Sectors decide direction. Companies decide winners.
You can pick the best-managed company in a dying sector — and lose money because GDP isn't flowing there. You can own an average company in a booming sector — and make exceptional returns because the tide is rising. You can nail stock selection but miss sector rotation — and underperform anyway.Thus, successful investing requires thinking on all of three levels simultaneously.
A real-time GDP proxy is far more useful than waiting for quarterly releases, and collections that consistently topped ₹1.7 lakh crore in late 2025 were a sign of India's strong and consistent consumption. It is typically a sign that demand is slowing down when GST collections fall below ₹1.5 lakh crore for a few months in a row.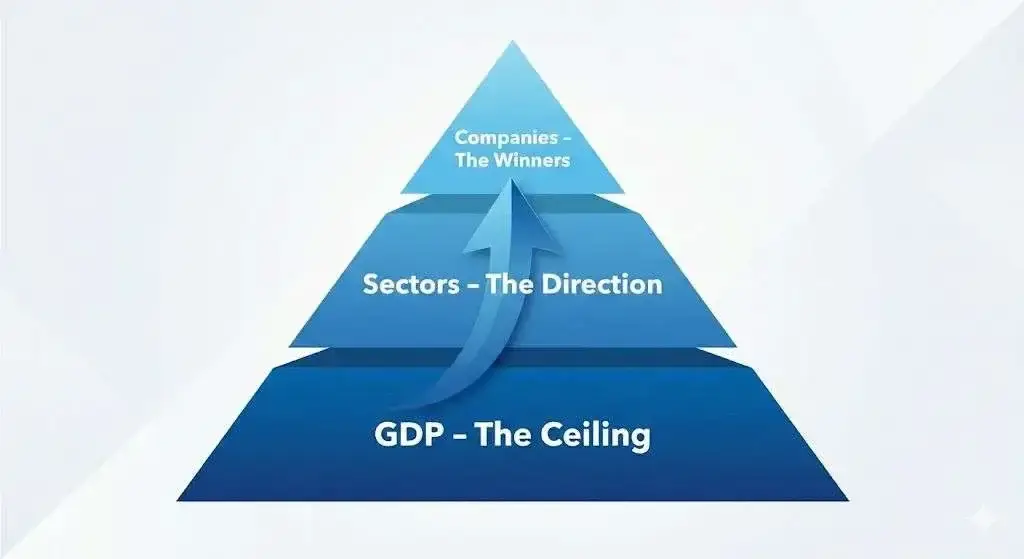
5. The 2003–2008 Capex Boom: The Lesson Everyone Forgot
If you want to understand how GDP creates multibagger returns — and how ignoring it destroys wealth — study this period carefully.What GDP Was Doing
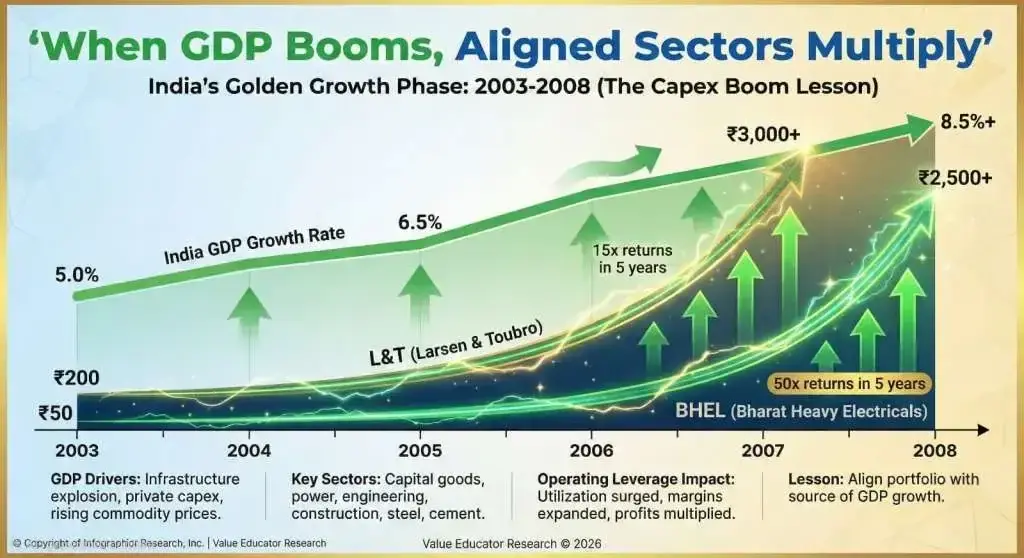
The golden period of India's growth phase took place between 2003 and 2008. During the period, the gross domestic product increased at a regular rate of 8.5%. Expenditure on infrastructure increased manifold. Capital expenditure by the private sector shot up. Credit was available in plenty and cheap too. Exporters benefited from rising global commodity prices. By and large, the economy as a whole was high on steroids.Nominal GDP growth — real growth plus inflation — was running at 12–15% year after year. That meant the national income pie was expanding by roughly ₹5–7 lakh crore annually (in 2003 terms). Where did that money go? Into construction, manufacturing, energy, metals — the sectors building India's physical economy.
This is exactly how cyclical vs defensive investing works in real life: Circulation vs. Consumption Stocks: Which Type is More Recession-Proof?
Which Sectors Won
This wasn't a stock picker's market. This was a sector-picker's market. Capital goods companies building machinery for factories, power plants, and infrastructure projects saw order books multiply. Power generation and transmission companies expanded capacity aggressively. Steel and cement companies couldn't produce fast enough to meet demand. Engineering and construction firms had backlogs stretching years.
These weren't 'hidden gems.' They were obvious beneficiaries — if you understood where GDP growth was coming from.
What Happened to Profits
Operating leverage kicked in brutally — in the best possible way- L&T's revenues grew from roughly ₹8,000 crore in FY03 to ₹45,000 crore in FY08 — a 5.6x increase. But profits? They went from roughly ₹400 crore to ₹3,500 crore, an 8.7-fold increase. The revenue growth was outstanding. The growth in profits was exponential.
- BHEL saw similar dynamics. Utilisation of the capacity increased from 70% to 95%. While revenues increased, fixed costs remained relatively unchanged. EBITDA margins increased to more than 25% from the mid-teens. Every incremental rupee of revenue dropped almost entirely to the bottom line.
- Tata Steel, Hindalco, Grasim — commodity companies normally known for thin margins — suddenly saw returns on capital exceeding 20–25% as utilization rates hit multi-decade highs and pricing power strengthened with demand.
This is what happens when GDP-driven demand exceeds supply for years.
What Happened to Stock Prices
- L&T: From ₹200 in 2003 to ₹3,000+ by early 2008 = 15x returns in 5 years
- BHEL: From ₹50 to ₹2,500+ = 50x returns
- Tata Steel: From ₹100 to ₹800+ = 8x returns
- ACC Cement: From ₹150 to ₹1,500+ = 10x returns
What Investors Should Remember
The lesson isn't 'buy cyclicals.' The lesson is:Align your portfolio with the source of GDP growth.
When the GDP grows due to investment-led (capex by government and private sector) factors, own Capex, infra, and materials. When the GDP grows due to consumption (increase in incomes, credit) drivers, such as own FMCG, automobiles, retail, and banks. When GDP growth is export-led (global demand, competitive advantages), own IT, pharma, speciality chemicals. The economy signals which sectors to overweight — years before the media catches on. But you have to be watching.
And here's the flip side nobody talks about: By 2009, after the global financial crisis hit and GDP growth collapsed, those same multibagger stocks gave back 50–70% of their gains. Investors who entered in 2007 thinking 'infrastructure is a long-term story' — which it was — still suffered years of losses because they ignored the GDP cycle.
This is how smart investors look stupid for 2 years, then look like geniuses for 10.
"The four most dangerous words in investing are: ‘This time it’s different." — Sir John Templeton
6. The GDP Mistakes That Cost Investors Lakhs
Mistake 1: Confusing Inflation with Growth
The headlines yell, "GDP grew 12%," and investors celebrate. The company reports a 12% increase in revenue. More is purchased by investors.Then they check margins. Flat. Or worse, declining. What happened? That 12% GDP growth was 6% real + 6% inflation. Half the 'growth' was just price increases across the economy. If the company's input costs rose 6% but it could only raise prices 4%, real margins compressed despite nominal revenue growth.
This is where retail gets trapped. They see growth without understanding the quality of growth.
The fix: Always separate real GDP from nominal. Always check if revenue growth is volume-driven or price-driven. Always establish whether revenue growth is volume-driven or price-driven. Always ensure that margins are not being compressed, even though revenue is increasing.
Mistake 2: Buying Tops Because 'The Story Is Strong'
GDP has been growing at 8% for three years. Infrastructure spending is booming. Cement stocks have tripled. Everyone on Twitter is posting charts about the 'decade-long capex supercycle.' You finally get convinced. You buy. Six months later, GDP growth moderates to 5.5%. Government spending slowed due to reasons like fiscal constraints. Cement stocks correct 45%.This is how people buy tops. They enter when the story is obvious, when everyone believes it, when it's been working for years, which is precisely when GDP cycles are about to turn.
The fix: The best time to buy cyclicals is when the economy grows slowly but shows signs of improving; the worst time to buy them is when the economy grows rapidly for years, and everybody's optimistic.
Mistake 3: Waiting for Perfect Data
Quarterly GDP data is delayed and subject to multiple revisions before being released. By the time 'official confirmation' of a slowdown in the economy is provided, stocks have already fallen 20-30%.Smart investors don't hold out. They monitor leading indicators: expansion is indicated by a PMI above 50, and contraction is indicated by one below 50. Credit expansion is either accelerating or slowing down. company remarks during earnings calls. Trends in capacity utilisation indicate higher auto sales and higher GST collections.
The fix: Use real-time proxies. Don't wait for backwards-looking official data to confirm what the market already knows.
Mistake 4: Ignoring Where Growth Comes From
GDP growth is not always the same.7% growth driven by government infrastructure spending benefits completely different sectors than 7% growth driven by rural consumption or export demand. If you own IT stocks during a domestic capex boom, you'll underperform — even though GDP is growing strongly and your companies are well-managed. You're in the wrong sectors for the current GDP driver.The fix: Understand GDP composition, not just the headline number. Investment-led? Consumption-led? Export-led? Then position accordingly.

7. How to Actually Use This (The Part Nobody Teaches You)
GDP cannot be used when you do not know how to use it. Thus, here is the feasible model:
Step 1: Track Leading Indicators (Not Lagging Data)
Disregard quarterly announcements of GDP. Markets have shifted by the time they become published. Instead, watch:- PMI Manufacturing & Services: Above 55 = strong expansion. Below 50 = contraction.
- Credit Growth: Bank lending accelerating? GDP is likely to follow. Decelerating? Warning sign.
- GST Collections: Crossing ₹1.7L cr consistently? Consumption strong. Dipping to ₹1.4–1.5L cr? Weakness building.
- Capacity Utilisation: Above 75% - companies likely to invest in expansion. Below 70% - cautious mode.
- Corporate Commentary: Listen to company management calls about their current activities—Are they expanding? Are they looking to hire?
Step 2: Identifying the GDP Growth Driver
Ask: What are we seeing economics growth from and what are the major drivers?
- Government capex surge? →Infrastructure, Capital Goods, Cement, Steel
- Rising rural incomes? →FMCG, two-wheelers, micro finance
- Urban consumption boom? → Discretionary retail, QSR, consumer durables
- Export demand surge? →IT services, Pharma, chemicals
- Real estate recovery? → Cement, home improvement, building materials
Match your asset allocation with the current growth driver. Don't fight the tide.
Step 3: Recognise When to Rotate
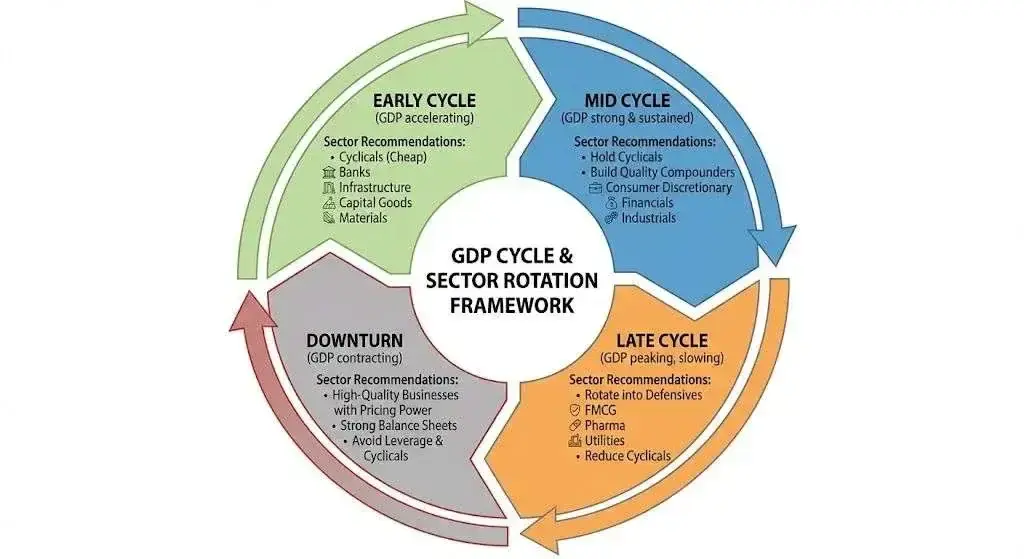
The reason GDP doesn’t increase in straight lines is that it does so in cycles. Similarly, your portfolio must do the same.- Early cycle (GDP accelerating from lows): Buy cyclicals cheap. Banks, infra, capital goods, materials.
- Mid cycle (strong and sustained growth in the GDP): Retain cyclicals but initiate the establishment of quality compounders. Consumer discretion, financials, industrials.
- Late cycle (maximum in GDP growth, first indicators of deceleration): Turn to defensives. FMCG, pharma, utilities. Reduce cyclical exposure.
- Recession (GDP shrinking or growing poorly): Keep only good businesses of quality and good balance sheets.
This is sector rotation in practice. It's not market timing. It's cycle awareness.
Sector rotation becomes practical only when you understand rebalancing: What is rebalancing? Why and When You Should Adjust Your Portfolio.
Step 4: Accept That You'll Be Wrong Sometimes
GDP is not a prediction that can be decided with accuracy. The unpredictable: pandemics, wars, policy shocks, and crises in the global world.The goal isn't perfection. The goal is directional correctness over time.
If you're right about GDP direction 60–70% of the time, you'll massively outperform investors who ignore it entirely. That's the edge.
"Far more money has been lost by investors preparing for corrections, or trying to anticipate corrections, than has been lost in corrections themselves."
— Peter Lynch
9. The One Thing to Remember
All of that matters. But they miss the forest for the trees.
Your stocks live inside the economy. As the economy expands the corporate earnings can go up. Even the most successful businesses find it difficult when it contracts.
GDP sets the ceiling. Sectors decide direction. Companies decide winners.
This isn't about abandoning fundamental analysis. It's about adding context. It's about understanding that a brilliant steel company bought at peak GDP growth can still destroy your wealth, while an average FMCG business bought during a slowdown can preserve it.You don't need to predict GDP perfectly. You just need to stop pretending it doesn't matter.
Observe the direction the economy is taking. Make your portfolio current in that direction. Rotate when cycles turn. Stay patient when others panic. That's the discipline that compounds wealth over decades.
And when the next crash comes — because it will — you won't be asking 'what just happened?' You'll already know. You'll understand that markets are repricing earnings expectations based on GDP forecasts. You'll see sector rotation happening in real-time. You will find that you see an opportunity where others can feel nothing but fear.
If you struggle with panic selling, this will help you massively: How to Stay Emotionally Strong During Market Crash.
That awareness — that clarity — is the edge that separates investors who survive from those who thrive.
"The individual investor should act consistently as an investor and not as a speculator." — Benjamin Graham
Key Takeaways: Your GDP Investment Checklist
- GDP is national income — the total earning capacity of the country
- Corporate revenues are a slice of GDP — they can't grow sustainably without it
- Operating leverage amplifies — small GDP changes create big profit swings
- Valuations reflect GDP expectations — growth premiums compress when forecasts disappoint
- Different GDP drivers favour different sectors — match portfolio to growth source
- Cycles are normal — GDP doesn't grow in straight lines
- Leading indicators matter more — don't wait for lagging official data
- Sector rotation beats stock picking — be in the right places at the right time
- The framework is simple: GDP → Sectors → Companies
- Perfect timing is impossible — directional correctness is enough
Explore our Products
Research Framework

Emerging Titans
Combination of quantitative analysis, industry tailwinds, and management assessment - SPRINT investment philosophy

Tiny Titans
Heavy emphasis on scuttlebutt research, plant visits, and early on-ground signals
FAQs
Does high GDP growth guarantee bull markets?
+No. GDP growth is necessary but not sufficient. Markets also depend on starting valuations, interest rates, global liquidity, and sector composition of growth. Strong GDP with expensive valuations can still deliver poor returns. Weak GDP with cheap valuations can surprise positively.
Can companies grow earnings if GDP is weak?
+Yes, momentarily, via market share acquisitions (cutting off competition), export expansion (entry into foreign GDP), cost reduction (smoothing the margins), or formalisation (stealing share out of the unorganised sector). However, it is hard to have consistently high increases in earnings, not supported by GDP, in 5-10 years.
Should I sell everything when GDP slows?
+No. Selling everything is rarely optimal. Instead: reduce cyclical exposure, hold quality businesses with pricing power, increase defensives allocation, keep cash for opportunities. Slowdowns are when great businesses go on sale — if you have liquidity and patience.
Which GDP number matters — real or nominal?
+Yes, both, but because of different reasons. The real GDP (inflation-adjusted) will inform you of the actual economic activity. Nominal GDP (inflation-adjusted) informs you on the growth potential of revenue because the corporations will show the figures in the existing rupees.Both real GDP (a method of sustainability) and nominal GDP (a method of revenue expectations) are to be attended to.
How do I track GDP in real-time without being an economist?
+Some simple proxies to watch are the PMI indices (published monthly), GST collections (published monthly), auto sales (published monthly), trend in credit growth (published every month), corporate earnings commentary (published quarterly). These series are released before the official GDP series and are available to all.

High growth stock specialist, Value Educator
Shashank Mahajan is an equity research professional with over 12 years of experience in identifying high-potential SME and micro-cap stocks at an early stage. He follows a rigorous scuttlebutt research–driven approach, combining on-ground insights with deep financial analysis. Shashank specializes in uncovering under-researched and under-owned companies with strong management quality and long-term growth potential. Through disciplined research and early identification, he focuses on spotting tomorrow’s market leaders before they enter the mainstream investor radar.

Glenmark: The USD 700 Mn Cancer Deal and Its Brands
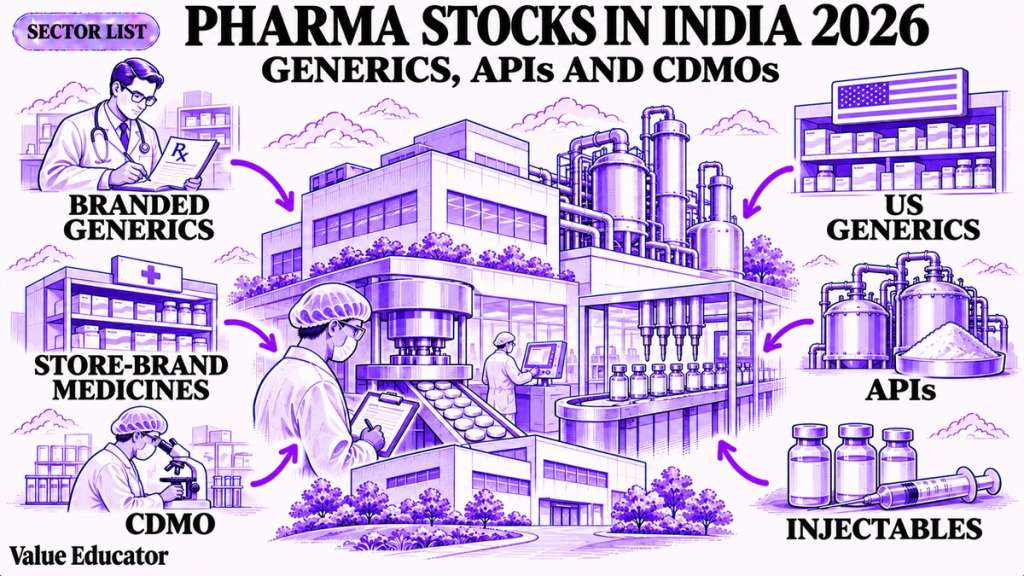
Pharma Stocks in India 2026: Generics, APIs and CDMOs
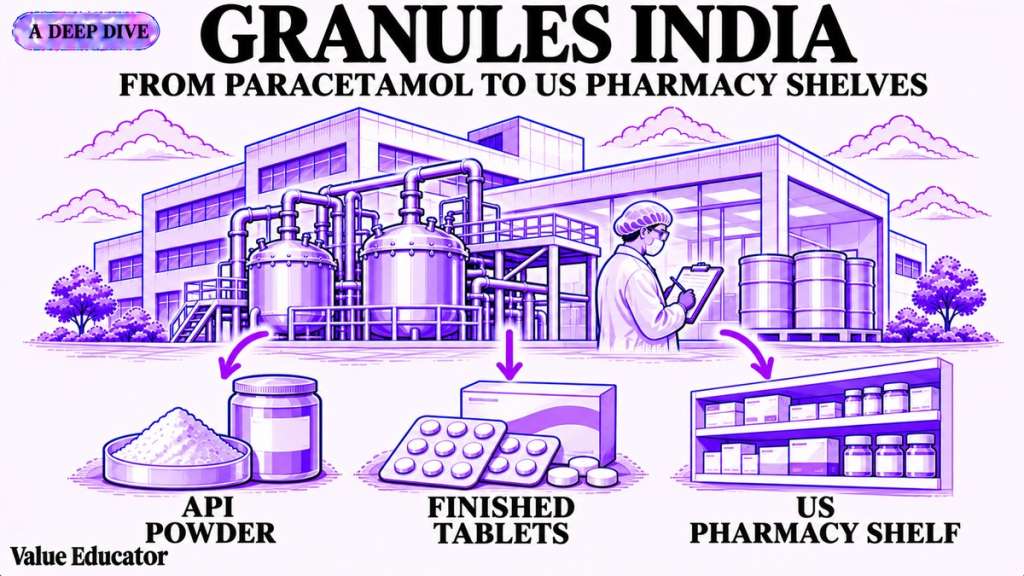
Granules India: From Paracetamol to a 65% Gross Margin

Natco Pharma: After Revlimid, 29 Patent Challenges

Shilpa Medicare: Cancer APIs, Films and Biosimilars

Alembic Pharma: US Plants Pay Back, Margin Hits 22.2%
Explore our Products
Research Framework
Emerging Titans
Combination of quantitative analysis, industry tailwinds, and management assessment - SPRINT investment philosophy
Tiny Titans
Heavy emphasis on scuttlebutt research, plant visits, and early on-ground signals



India's Aerospace Opportunity
Global Demand. Supply Bottlenecks. Opportunities Ahead.
Don't Miss This Exclusive Webinar!
Join Value Educator to decode the key trends shaping India's aerospace sector and learn how to identify tomorrow's potential leaders in the space.
- How the aircraft value chain works, layer by layer
- Indian companies supplying global aircraft makers
- A framework to judge any aerospace company

 Orders
 Subscription
 Share with friends


Required Details
₹23999.00
(12 month subscription)
As per SEBI regulations, all users are mandated to complete the KYC that is validated for 1 year. Post payment, you will be redirected to the KYC screen


No comments yet. Be the first to comment!