
What Are Nifty and Sensex?

Why Market Indices Exist – From Chaos to Clarity
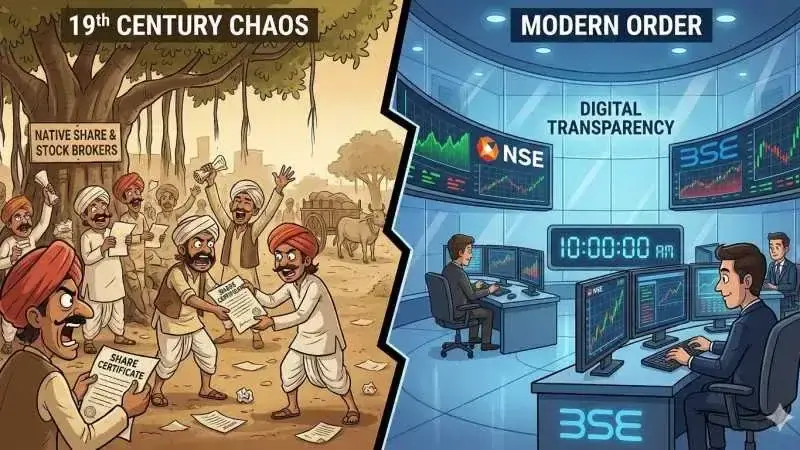
India's stock market was really crazy a while ago. This was before we had computers and mobile apps. A small group of brokers used to meet under a tree in Mumbai's Fort area. They would trade paper share certificates with each other.
The Bombay Stock Exchange was set up in 1875. Even then, people were still yelling and using hand signals to trade. They had to remember everything in their head. India's stock market has come a long way from those days.
This system worked until it stopped working. The system was fine for a while. Then it just did not work anymore. This system that we are talking about just stopped working one day.
Prices were hard to track, disputes were common, and manipulation was easy because there was no single, reliable way to know how the market as a whole was performing. Investors had to look at hundreds of individual stocks just to get a rough sense of direction.
The market needed something really simple:
I think what people are looking for is one number that can tell us how the whole market is feeling. This one clear number could summarize the market's mood.
That need for clarity gave birth to market indices—and eventually to the two most important names every Indian investor hears daily: Sensex and Nifty. As Albert Einstein said, “In the middle of difficulty lies opportunity”—and this chaos created the need for a clear market index.
For readers completely new to equities, this sits within the broader structure of how the Indian stock market works. Read more on: A Beginner's Guide to Investing in the Indian Stock Market (2025 Edition)
Birth of Sensex and Nifty – The Foundation of Modern Indian Markets
India made a move to get its stock market in order in 1986. This is when the Bombay Stock Exchange, which is also called the BSE, came up with the Sensex. The Sensex took the 30 companies, in India and put them together into one number. This made it a lot easier for people to keep track of what was going on in the market.
The Sensex was a simple idea, but it was also very powerful. Leonardo da Vinci said something that makes a lot of sense here. He said that simplicity is the way to be sophisticated. So when the Sensex came along with its number, it made investing a lot easier for people to understand. India's stock market and the Sensex are still important today.
The Sensex fixed an issue, but the system that the Sensex used was still really old. When people wanted to trade, they had to do it by hand, and it took time to settle everything. Sometimes it took weeks. The Sensex did not have a lot of transparency. The Sensex had some weaknesses, and these weaknesses were clearly seen when the Harshad Mehta scam happened in 1992. This scam showed how easily paper-based systems, like the Sensex system, could be taken advantage of.
To fix this problem, India did not just need an index it needed a better market structure. India needed to make some changes to the market structure to really fix things. The index was one part of the problem, and India had to do something about the whole market structure.
The National Stock Exchange, or NSE for short, started doing things in 1992. That is when the National Stock Exchange launched. The National Stock Exchange was not like the exchanges. The National Stock Exchange introduced a way of trading that was fully electronic and used screens.
When people wanted to buy or sell something on the National Stock Exchange, their orders were matched using computers. This meant that the National Stock Exchange could get rid of a lot of problems that the old exchanges had, like noise and confusion, and people making decisions.
Two years later, in 1996, NSE launched the Nifty 50—an index tracking 50 large, liquid companies across key sectors of the Indian economy.

The Sensex and Nifty have completely changed the markets. They took the markets from being really crowded and confusing to being easy to understand and accessible to everyone. Now when people say the market is going up or down, they are usually talking about the Sensex and Nifty. The Sensex and Nifty are the two things that people look at to see how the market is doing.
But as India’s economy grew, investors began to realize something important.
Why One Index Was Not Enough
In the years, one index was enough to show how the market was doing.. By the late 1990s and early 2000,s India was changing very fast:
- Technology companies were booming
- Private banks were expanding aggressively
- Consumption was rising
- Some traditional sectors were lagging
Different parts of the economy were moving at different speeds. One number could show the direction of the market—but not the full story.
As legendary investor Peter Lynch once said,
“A single average hides more than it reveals.”
This raised an important question for investors:
How do you track specific sectors, company sizes, and growth opportunities without relying only on the Sensex or the Nifty?
The answer was the creation of multiple types of market indices.
Types of Market Indices in India (Explained Simply)
To give investors deeper insights, stock exchanges introduced different indices, each designed for a specific purpose.

1. Broad Market Indices
These show the overall direction of the market.
- Sensex – Tracks 30 large companies on BSE
- Nifty 50 – Tracks 50 large companies on NSE
If you want to know how the Indian stock market is doing overall, these are the numbers to watch.
2. Sectoral Indices
These track specific industries.
- Nifty Bank – Banking and financial services
- Nifty IT – Technology companies
- Nifty Auto – Automobile sector
Sectoral indices help investors understand which parts of the economy are leading or lagging.
3. Market-Cap Based Indices
These classify companies by size.
- Nifty Next 50 – Potential future blue-chips
- Nifty Midcap 150 – Medium-sized, high-growth firms
- Nifty Smallcap 250 – Smaller, higher-risk companies
Together, these indices allow investors to see the market not as one block, but as layers of opportunity and risk.
People who invest money can keep an eye on the market and also look at specific parts of it, like certain types of companies or industries, by knowing about the different kinds of indices. This way of looking at the market helps us ask an important question: how do Nifty and Sensex, which are the most well-known indices, really work as benchmarks for people who buy and sell stocks and for other people who are involved in the market like Nifty and Sensex.
The Nifty and Sensex are really important. They are used to measure how the stock market is doing.
When we want to know how our investments are doing, we look at the Nifty and Sensex.
The Nifty and Sensex are like benchmarks that people use to compare. They are really helpful because they show us what is going on in the stock market with the Nifty and Sensex.
We can see how the Nifty and Sensex are performing. That tells us a lot about our own investments and the Nifty and Sensex.
When we talk about the Nifty and Sensex, we are talking about the stock market. The Nifty and Sensex show us the performance of many big companies. This helps investors make decisions.
The Nifty and Sensex are also used to compare the performance of investments. For example, people can compare how their mutual funds are doing compared to the Nifty and Sensex. This gives them an idea of how good their investments are.
Overall, the Nifty and Sensex are useful tools. They help people understand the stock market and make decisions about their investments. The Nifty and Sensex are benchmarks that everyone looks at.
Indices are not just tools for tracking market movements—they are benchmarks used by various market participants:
How Nifty and Sensex Are Used as Benchmarks
Indices are not just tools for tracking market movements—they are benchmarks used by various market participants:
Mutual Funds & Portfolio Managers
They compare their fund performance against Nifty or Sensex to evaluate whether they are generating alpha (returns above the benchmark). For example, a large-cap equity fund might aim to beat the Nifty 50.
Institutional Investors & Pension Funds
These participants often use broad-market indices to maintain portfolio alignment with market performance. If Nifty rises 10% in a year, institutional managers aim for similar or better returns for their large-cap allocations.
Derivatives & Hedging
Traders use Nifty futures and options as benchmarks for hedging portfolios or speculating on market direction. These indices provide a standardized, liquid instrument for risk management.
Retail Investors
Individual investors use indices to understand market trends, compare stocks, or decide where to allocate capital (like choosing index funds).
Economic & Policy Analysis
Policymakers and analysts use index movements as barometers of investor sentiment and economic health. Rising indices can indicate optimism; falling indices may reflect concern.
In short, Sensex and Nifty act as the “yardstick” for measuring performance, risk, and sentiment across the Indian financial ecosystem.
Understanding how different participants rely on Nifty and Sensex as benchmarks is important—but it naturally leads to another question: what actually drives these indices to move up or down every single day?
What actually makes Sensex and Nifty move every day?
Once you understand NSE Sensex explained at a structural level, the next logical question is:
Why do these numbers change daily?
Five core forces drive index movement:
- India’s Economic Health – GDP growth, inflation, interest rates, and corporate earnings influence investor confidence. For example, in FY24, India’s GDP growth of 6.1% boosted market sentiment.
- Sector Performance & Weightage – Financials, IT, and FMCG heavily impact indices. A strong quarter by HDFC Bank can push the Nifty 50 up.
- Foreign Institutional Investors (FIIs) – Large foreign fund inflows in 2023 added over ₹1 lakh crore to equities, lifting indices.
- Global Events – US Fed rate hikes, oil price shocks, or geopolitical tensions affect the indices instantly.
- Heavyweight Company Movements – A sharp fall in Reliance or Infosys can drag the entire index even if most stocks are steady.
These forces show that indices are influenced by a mix of economic, sectoral, and company-specific factors. But a common question arises among beginners: are the indices themselves driving the market, or are it the individual stocks that move the indices?
Do Stocks Move the Index, or Does the Index Move Stocks?
Many beginners get confused about this, thinking that when an index moves, it somehow forces stocks to follow. The truth, however, is much simpler: stocks move the index — not the other way around. Think of Nifty and Sensex as mirrors; they don’t lead the market—they reflect it. The companies inside these indices, especially the ones with the largest weightage, are the ones pulling the strings.
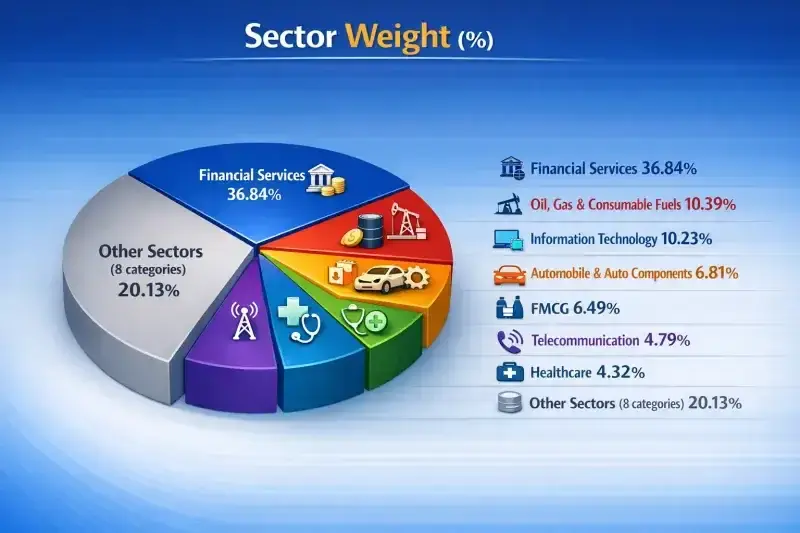
Let’s make this real with an example. In recent market action, when the Nifty IT index slid about 1.44% after quarterly results from major IT firms like Wipro and Infosys showed weaker‑than‑expected performance, their share prices fell sharply. Infosys dropped roughly 1.8% on that day, and other tech names also slid, pushing down the whole IT index. This was despite many other non‑IT stocks trading steadily—yet the weight of Infosys and its peers was enough to drag the sector index lower, and contribute to pressure on broader indices like Nifty 50.
This is a classic example of how a company’s individual performance drives index movement: when Infosys and other big IT players reported results that disappointed investors, it wasn’t the index leading the move—it was the stocks themselves falling first that caused Nifty IT (and by extension Nifty) to slip.
Once the index starts moving, it can influence investor behavior—so you might then see traders sell other stocks because the headline Nifty number looks weak. That creates a feedback loop: stocks move the index, and the index then shapes investor sentiment, which in turn can cause further stock movements. Understanding this helps beginners see that indices are reflections of the market, not market drivers themselves.
Seeing how individual stocks drive index movements naturally leads to another question: how does the movement of an index, in turn, affect investor behavior and market psychology?
How Index Movement Affects Market Psychology
When people buy and sell stocks, it affects the index. The index also has a big impact on the people who invest in the stock market. The index becomes an important signal that influences what investors do with their money, and investor behavior is shaped by the index. The index really matters to investors. The index plays a big role in their decisions.
In early 2020, COVID-19 fears triggered a sharp crash in the Sensex and Nifty, with markets falling over 37%. Months later, when vaccine breakthroughs were announced, indices rebounded strongly. What’s important to understand is this: company fundamentals didn’t change overnight — expectations did.
As fear gave way to hope about reopening economies, investors started buying across sectors. Rising index levels signaled confidence, which attracted more buyers. Falling indices, on the other hand, spread fear and encouraged selling. This creates a feedback loop where sentiment amplifies price movements.
This highlights a key market truth: indices don’t just report what has happened — they influence how investors interpret what might happen next. They act as a barometer of collective psychology, often magnifying market moves beyond immediate fundamentals.
Understanding this psychological role of indices naturally leads to a deeper question: what exactly do indices reveal — and what do they hide?
What Indices Tell You — and What They Hide
Think of indices like a thermometer for the market: they tell you whether it’s “hot” or “cold,” but they don’t reveal every detail underneath. Indices are powerful tools, yet they come with limits.
What Indices Reveal
When you look at Nifty or Sensex, you can quickly figure out what is going on with Nifty or Sensex. You get a good idea of Nifty or Sensex just by looking at Nifty or Sensex.
- Overall market direction – whether markets are broadly rising or falling.
- Large-cap strength – how the biggest, most influential companies are performing.
- Investor sentiment – the general mood of buyers and sellers in the market.
For example, if the Nifty 50 climbs 10% over a quarter, it signals that India’s largest companies are generally performing well, and investor confidence is strong.
What Indices Don’t Reveal
However, indices hide important layers of the market:
- Individual stock performance – smaller movers may be rising or falling even if the index looks stable.
- Midcap and smallcap trends – these segments can behave very differently from large-cap stocks. This is exactly why experienced investors often look beyond headline indices, as discussed in :Why Mid Cap Stocks are the Sweet Spot for Long-Term Investors.
- Market breadth and hidden opportunities – just because the headline number is up doesn’t mean every sector or stock is performing.
A real-world example makes this clear. In 2025, the Nifty 50 ended the year up around 10.5%, extending a decade of annual gains and delivering a comfortable headline return for India’s large-cap stocks. Yet the broader market told a very different story: the Nifty Midcap 150 rose only about ~5.4%, while the Nifty Smallcap 250 actually declined nearly 6% over the same period — a sharp divergence from the large-cap benchmark. This shows that, even in a “positive” market year, broad averages can mask underlying stress and investor risk aversion in non-large-cap segments. An investor relying solely on the Nifty’s 2025 headline rise might have misread the market’s health, missing the mid- and small-cap weakness that was unfolding beneath the surface.
This brings us to an important concept: market divergence. Sometimes, large-cap indices can climb while smaller segments lag—or vice versa. Divergences like this are common and highlight why it’s crucial to look deeper than just the headline numbers. Indices give you the temperature of the market, not the full weather report.
Understanding these limits naturally raises the next question: how can investors use indices wisely without being misled by what they hide?
Market Divergence: When Signals Conflict
In 2025, the Indian market provided a real, fact‑based lesson on market divergence — where different parts of the market move in opposite directions. For much of the year, large‑cap indices like the Nifty 50 and Sensex hit new highs, reflecting strong performance among India’s biggest companies. At the same time, small‑cap and mid‑cap indices were under pressure, showing a very different picture beneath the surface.
For example, in early February 2025, the Nifty Smallcap 100 Index fell over 2% and was down more than 11% year‑to‑date, even as broader market headlines remained relatively positive, highlighting weak sentiment among smaller stocks. Meanwhile, the Nifty 50 continued to outperform, rising modestly or holding steady in the same period. This mismatch showed that while big names attracted investor money, smaller companies were being left behind because of risk aversion and liquidity concerns.
Later in 2025, this pattern continued — in November, for example, the Nifty Smallcap 100 fell nearly 3% during a month when the Nifty 50 rose about 1.8%, underscoring how smaller stocks can lag even as the headline benchmark climbs. The divergence was fueled in part by foreign institutional selling and selective domestic buying that favored larger, more stable companies.
This real‑world divergence matters because it shows that a rising Nifty 50 doesn’t mean all stocks are doing well — smaller and riskier segments can behave very differently. Understanding this prevents beginners from misreading headlines and thinking the entire market is strong just because the index is. Such phases often expose behavioural and valuation mistakes, covered in detail in: Common Mistakes Every Small-Cap Investor Makes (And How to Avoid Them).
This divergence highlights the importance of understanding not just what the indices are doing, but also how extreme movements in either direction are managed. To protect investors and maintain market stability during such volatile periods, Indian exchanges rely on upper and lower circuit breakers.
Upper and Lower Circuits: Market Safety Nets
In extreme market conditions, emotions can run wild, causing panic selling or irrational buying. To manage this, Indian exchanges introduced upper and lower circuit breakers — automatic mechanisms that temporarily halt trading when prices swing too sharply.
For example, if the Nifty rises or falls by 10%, 15%, or 20% in a single day, trading is paused for a set period. This gives investors a chance to reassess and prevents hasty decisions driven purely by fear or euphoria.
A real-world instance of their importance came during the COVID-19 crash in March 2020. On March 12, 2020, the Sensex and Nifty plunged by around 9–10% within minutes of opening, triggering market-wide lower circuits. Trading was halted on both NSE and BSE, giving investors time to process the unprecedented volatility. Without these pauses, the panic could have escalated further, resulting in even sharper declines.
These safety nets show that while indices reflect market movement, regulators actively work to prevent disorderly swings that could harm investors, especially beginners who might react emotionally to sudden drops or spikes.
With this understanding of how markets are protected during extreme swings, the next step for beginners is learning how to use Nifty and Sensex effectively in their own investing decisions.
How Beginners Should Use Nifty and Sensex
Understanding how Nifty and Sensex move is one thing, but knowing how to use them in your own investing is another. For beginners, the key is to start simple and gradually build confidence. As Benjamin Franklin wisely said, “An investment in knowledge pays the best interest.”—Before picking individual stocks, beginners should first learn how indices work.
1. Start With Index Funds or ETFs
Instead of selecting individual stocks, beginners can invest in index funds or ETFs that track Nifty 50 or the Sensex. This approach provides instant diversification across India’s top companies at a low cost, reducing risk while giving exposure to overall market growth.
Over long periods, this approach works because of compounding — explained clearly in The Power of Compound Interest: How to Create Wealth in the Stock Market.
2. Track Sector Indices
Once comfortable with broad indices, beginners can observe sector-specific indices like Nifty Bank, Nifty IT, or Nifty Pharma. Tracking these helps identify economic trends and sector performance before choosing individual stocks. For example, if Nifty Bank consistently outperforms, it signals strength in the financial sector, guiding investment decisions.
3. Gradually Explore Midcaps and Smallcaps
With experience, beginners can cautiously venture into midcap and smallcap stocks or mid and smallcap indices, which often offer higher growth potential but come with higher risk. Observing indices like Nifty Midcap 150 or Nifty Smallcap 250 allows trend analysis without taking concentrated bets on individual companies.
Following these steps, beginners can use Nifty and Sensex as a guide, not a decision-maker, building confidence and understanding before venturing into riskier segments. As investors gain experience, they realize that focusing solely on Nifty isn’t enough—this is when seasoned investors start looking beyond the headline indices to uncover broader opportunities.
Why Experienced Investors Look Beyond the Nifty
Nifty 50 is India’s most recognized benchmark, and beating it is considered generating “alpha”—returns above the market. However, experienced investors know that large caps aren’t the only place to find growth.
In recent years, midcap and smallcap indices have often outperformed Nifty. For example, in 2021–2022, the Nifty Midcap 150 and Nifty Smallcap 250 indices delivered double-digit gains that exceeded Nifty 50’s performance, rewarding investors who understood the layers beneath headline numbers.This trade-off between stability and outsized returns is explored deeper in Multibagger Stocks vs Bluechip Stocks – Which Builds More Wealth?
This approach shows that seasoned investors don’t just follow the headlines—they look deeper, balancing risk and opportunity across large, mid, and small caps.
Beginners, however, often make a critical mistake when starting.
The Biggest Mistake Beginners Make
The most common mistake beginners make is assuming that Nifty or Sensex represents the entire market. In reality, these indices capture only a slice of India’s equity universe—primarily large, well-established companies.
Because of this, beginners often misread market conditions. A rising Nifty may create the impression that “everything is doing well,” even when midcap or smallcap stocks are struggling. Similarly, a flat index can hide strong performance in specific sectors or individual companies.
This misunderstanding can lead to poor decisions—such as entering the market at the wrong time, ignoring opportunities outside large caps, or panicking during short-term index declines. Recognizing that indices are summaries, not complete pictures, helps investors avoid reacting emotionally to headline numbers and encourages deeper analysis.
Many of these mistakes stem from weak basics, which is why mastering concepts in 10 Stock Market Terms Every Beginner Must Know Before Investing is essential.
Explore our Products
Research Framework

Emerging Titans
Combination of quantitative analysis, industry tailwinds, and management assessment - SPRINT investment philosophy

Tiny Titans
Heavy emphasis on scuttlebutt research, plant visits, and early on-ground signals
Conclusion
Most beginners misunderstand Nifty and Sensex not because they lack information, but because they mistake the index for the market itself. These indices are powerful — they help you read direction, sentiment, and the strength of India’s largest companies — but they are still summaries. They reveal trends at the surface while hiding what is happening beneath in midcaps, smallcaps, and sectors that move differently across cycles. The real edge comes from learning when to look at the index — and when to look beyond it.
Nifty and Sensex are not signals for prediction — they are tools for context, discipline, and asset-allocation decisions. Used wisely, they help investors think in frameworks rather than headlines. Used blindly, they encourage emotional reactions to short-term moves.
If this guide helped you understand indices in a clearer, more practical way, comment “INDEX” below.
Like the post if you want more research-backed investing breakdowns, share it with someone who is starting their market journey, and tell me in the comments — do you track only Nifty/Sensex, or do you also follow midcap/smallcap indices when analysing the market?
The strongest investing habits are built not from noise — but from clarity, structure, and thoughtful observation.
FAQs ( Frequently Asked Questions )
What is Nifty in simple words?
+What is Sensex explained simply?
+Is it better to invest in Nifty or Sensex?
+Why are there two exchanges in India?
+Why do indices have limited companies?
+
High growth stock specialist, Value Educator
Shashank Mahajan is an equity research professional with over 12 years of experience in identifying high-potential SME and micro-cap stocks at an early stage. He follows a rigorous scuttlebutt research–driven approach, combining on-ground insights with deep financial analysis. Shashank specializes in uncovering under-researched and under-owned companies with strong management quality and long-term growth potential. Through disciplined research and early identification, he focuses on spotting tomorrow’s market leaders before they enter the mainstream investor radar.

Glenmark: The USD 700 Mn Cancer Deal and Its Brands

Pharma Stocks in India 2026: Generics, APIs and CDMOs

Granules India: From Paracetamol to a 65% Gross Margin

Natco Pharma: After Revlimid, 29 Patent Challenges

Shilpa Medicare: Cancer APIs, Films and Biosimilars

Alembic Pharma: US Plants Pay Back, Margin Hits 22.2%
Explore our Products
Research Framework
Emerging Titans
Combination of quantitative analysis, industry tailwinds, and management assessment - SPRINT investment philosophy
Tiny Titans
Heavy emphasis on scuttlebutt research, plant visits, and early on-ground signals



Modern Warfare to Multibaggers
Key Trends. Strategic Shifts. Opportunities Ahead.
Today at 7:00 PM IST. Room opens 30 minutes before.
Don't Miss This Exclusive Webinar!
Join Value Educator to decode the key trends shaping India's defence sector and learn how to identify tomorrow's potential leaders in the space.
- In-depth research on India's defence sector
- Live Q&A session
- Actionable takeaways for long-term investors

 Orders
 Subscription
 Share with friends


Required Details
₹23999.00
(12 month subscription)
As per SEBI regulations, all users are mandated to complete the KYC that is validated for 1 year. Post payment, you will be redirected to the KYC screen


No comments yet. Be the first to comment!