
What Is a Stock Market Index? Beyond Nifty

Why Your Portfolio Might Be Underperforming Despite “Beating the Market”
The Investor Who eat Nifty But Still Lost Money
March 2021. A friend called me excited. “I’m up 45% this year. Nifty is only up 15%. I’m crushing it!”He’d gone all-in on small-cap stocks. Every stock was green. His portfolio dashboard showed him in the top 5% of investors. He was convinced he’d cracked the code.
Fast forward to October 2021. The same friend called again. This time, no excitement. Just confusion.
“I’m down 30% from my peak. But Nifty is only down 5%. What happened? I was beating the market by so much.”
This is the conversation that reveals everything wrong with how investors understand indices. He wasn’t beating “the market.” He was beating ONE index while being exposed to a completely different market segment. When that segment crashed, his outperformance vanished — and turned into devastating underperformance.
Nobody explains this when they say “beat the market” — which market are you even talking about? Nifty 50 represents 50 large-cap stocks. Sensex tracks 30 blue-chips. But India has over 4,000 listed companies. Different indices capture different segments. And each segment moves differently — sometimes in completely opposite directions. This is where investors get destroyed.
They compare their portfolio to Nifty while owning mid-caps. Or they chase small-cap returns without understanding the small-cap index’s volatility. Or they think “sectoral rally” means the whole market is booming, never realizing that IT might be up 40% while banking is down 15%.
If you’re new to indices and want the basics first, read: What is Nifty, Sensex & Market Indices? Beginners Guide
If you’ve ever felt confused about why your stocks fell when “the market was up,” — this article will show you why. If you’ve ever wondered how fund managers “beat the index” consistently, you’ll understand the game. And if you’ve ever thought Nifty and Sensex represent the entire Indian stock market, you’re about to discover how much you’ve been missing.
This isn’t about learning definitions. It’s about understanding that when someone says “the market,” they’re really talking about one specific index — and that index might have nothing to do with your portfolio or the opportunities you’re missing.
An index isn’t the market. It’s a measuring stick. And if you’re measuring with the wrong stick, every decision you make will be distorted.
1. What an Index Actually Is (And Why It’s Not “The Market”)
The Simple Truth Everyone Misses
An index is just a curated list of stocks with a calculation method. That’s it. Nothing mystical. Someone picks a group of stocks based on specific criteria, assigns them weights, and tracks how they move collectively. Think of it like a playlist — Spotify’s “Top 50 India” isn’t all Indian music. It’s 50 selected songs based on popularity. Different playlists capture different moods — sad songs, party songs, 90s hits. Each playlist is valid. None represents ALL music. Indices work the same way.Nifty 50 is a playlist of India’s 50 largest, most liquid companies. Sensex is 30 blue-chip stocks. Nifty Midcap 150 is 150 mid-sized companies. Bank Nifty is banking stocks. Each captures a different segment. None is “the market.” When someone says “I beat the market by 20%,” the first question should be: which market?
If they beat Nifty 50 by 20% by investing in small-caps during a small-cap rally, they didn’t beat “the market” — they took more risk in a segment that happened to outperform. The moment that reverses, they’ll underperform by 30%.
Real example from 2017-2018 shows this perfectly. The small-cap index rose 60% in 2017 while Nifty rose only 25%. Investors piled into small-caps thinking they’d “figured it out.” Then 2018 happened. Small-cap index fell 40%. Nifty fell only 5%. Those who compared themselves to the wrong index got crushed. Every index has three core components that determine how it behaves. First is the selection criteria — who gets in. Market cap, liquidity, sector representation, profitability all matter.
Nifty 50 requires minimum market cap and trading volume. Sectoral indices require the company to be in that sector. Second is the weighting method — who matters more. Free-float market cap weighted is most common, but there’s also equal weighted and price weighted. In Nifty 50, Reliance with ₹17 lakh crore market cap has more impact than smaller companies. One Reliance move affects the index more than five smaller stocks combined. Third is rebalancing rules — who stays or leaves. Semi-annual or quarterly reviews happen where companies that no longer meet criteria get removed and new companies that qualify get added.
The most common trap that most investors make is to believe that an index is inactive. It's not. Nifty 50 is not what it used to be a decade ago. The companies are added and dropped depending on performance. You are not investing in the same index - you are investing in an ever-changing list.
This is important since by purchasing a Nifty 50 index fund today you are not committing yourself to purchase the 50 companies today indefinitely. It is possible that in the coming ten years, 15-20 of them will be replaced. The index changes to remain relevant, however, your knowledge about what you own must also change.
“In the short run, the market is a voting machine. In the long run, it’s a weighing machine. And indices are the scorecards.”
— Benjamin Graham (adapted)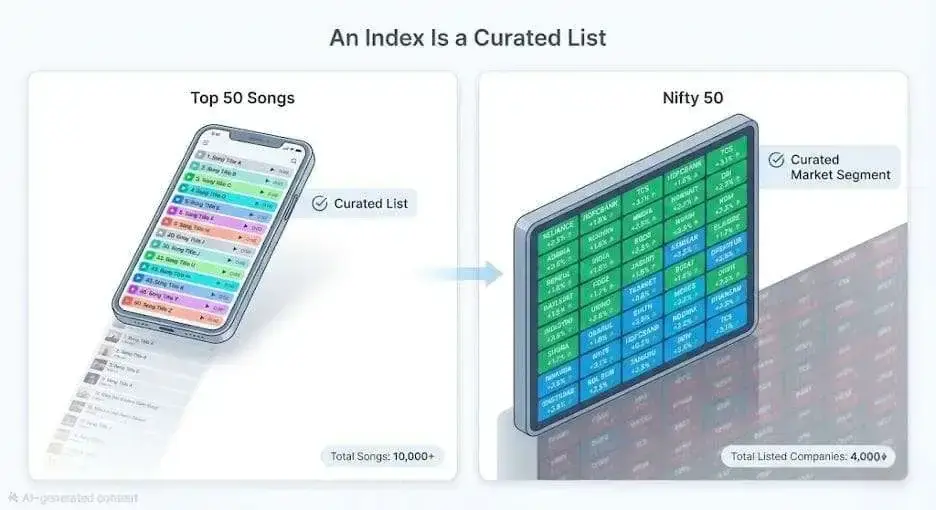
2. Nifty 50 vs Sensex: Why Two “Markets” Move Differently
The 50 vs 30 Debate
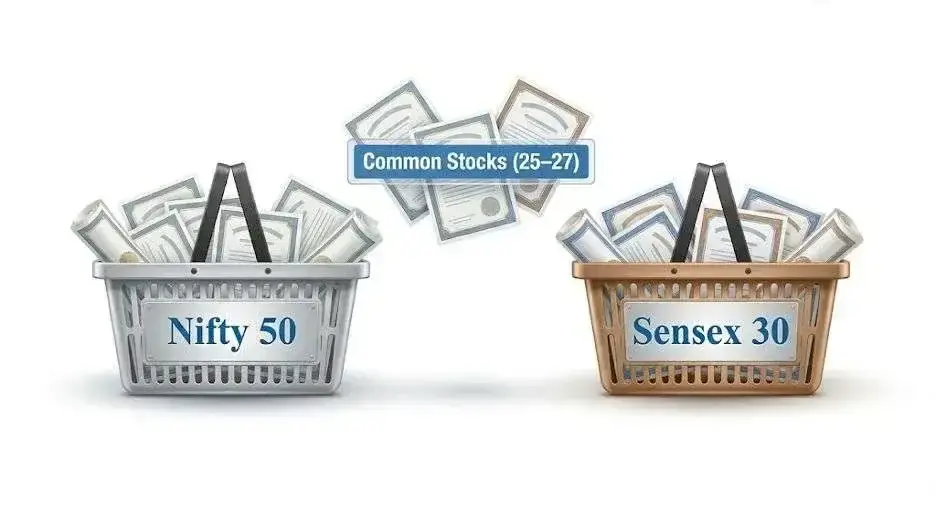
Almost everyone tracks Nifty and Sensex, but very few understand how they actually differ.. Most investors don’t fully understand the difference between the two.. Both track large-cap stocks. Both are market-cap weighted. But they're NOT the same.Nifty 50 is a free-float market-capped fund that consists of 50 stocks of 13 sectors run by NSE Indices (a subsidiary of the National Stock Exchange). Sensex has 30 stocks of 10-12 sectors, which are run by the S&P Dow Jones Indices and BSE, and it is also free-float market capital weighted. The major difference that no one is talking about is that the stock overlap is not more than 25-27 companies. That is, 23 stocks of Nifty are not in the Sensex. And not all Sensex stocks are in Nifty.
On most days, Nifty and Sensex move almost together, with a correlation above 95%. Nifty is up 1% and Sensex is typically up 0.9 -1.1%. However, they do not always go in the same direction, and then it becomes interesting. This is brought about by a different stock composition. In the event that the 5-6 stocks existing in the Sensex that are not Nifty shoot, Sensex performs better. Nifty performs better when the larger Nifty 50 base performs. The investor trap comes in when the news is that the Sensex has passed 60,000, but your Nifty index fund is marginally in the rear, and you are asking yourself why. It is because you compare various baskets.
For passive investing through index funds, it doesn’t matter much — both deliver similar long-term returns. Nifty has slightly more liquidity and better options for derivatives. For active benchmarking, use the index that matches your portfolio.
If you own mostly large-caps in Nifty, compare to Nifty. If your mutual fund holds mid-caps, comparing to Nifty 50 is wrong — use Nifty Midcap 150 instead. The reality is that most investors should track Nifty because it’s broader (50 vs 30 stocks) and more representative of large-cap performance.
“The stock market is filled with individuals who know the price of everything, but the value of nothing. And they compare to the wrong indices.”
— Philip Fisher
3. Broad-Based Indices: Nifty 500, Nifty Total Market, and Why They Matter
Beyond the Top 50
Nifty 50 represents about 65% of India’s total market capitalization. That means 35% of the market exists outside Nifty 50 — thousands of companies ignored by the headline index. Broad-based indices capture more of the market and give you a much clearer picture of what’s actually happening.Nifty 100 consists of the 100 largest companies based on market capitalisation and an addition of 50 stocks over and above Nifty 50 and represents an approximation of 80 per cent of the total market capital. Nifty 500 is comprised of the 500 best companies, is a combination of large, mid, and small-cap stocks, and approximates 95 per cent of the overall market capital in India. This is as much as you can get to the whole market in a single index. Nifty Total Market Index goes further to include all listed companies (4,000+), which have adequate liquidity and represent the entire market that can be invested in.
Broad indices matter more than most investors realize, especially when the headline index is flat but the broader market is rallying. This happens during mid-cap and small-cap rallies. Nifty 50 might be up 5% for the year, but Nifty 500 is up 15%. Investors who only track Nifty think the market is “doing nothing” — while missing massive moves in mid and small-caps.
The real 2017 example proves this. Nifty 50 was up 28%, which sounds great. But Nifty Midcap 100 was up 48%, and Nifty Smallcap 100 was up 60%. If you only tracked Nifty 50, you’d think it was a decent year and completely miss that mid and small-caps were having a historic rally.
Then came the 2018 reversal that crushed anyone who wasn’t paying attention to the broader indices. Nifty 50 was up 3% for the year — barely moved. But Nifty Midcap 100 was down 12%, and Nifty Smallcap 100 was down 24%. The headline index barely moved, but if you owned mid or small-caps based on 2017’s performance, you got destroyed. This is why understanding broad indices is critical for three specific reasons.
First, for understanding market breadth — compare Nifty 50 to Nifty 500. If Nifty 50 is up but Nifty 500 is flat or down, the rally is narrow and only large-caps are rising. That’s a weak rally. If both are rising together, the rally is broad-based and healthier.
Second, for diversification decisions — if you own a Nifty 50 index fund, you have zero exposure to mid and small-caps. Adding a Nifty 500 index fund or Nifty Midcap 150 index fund gives you exposure to the other 65% of the market. Third, for reality checks — if your portfolio is up 30% while Nifty 50 is up 15%, don’t assume you’re a genius. Check Nifty Midcap or Nifty Smallcap first. You might just be riding a segment rally that could reverse violently.
“Diversification is protection against ignorance. It makes little sense if you know what you’re doing.”
— Warren Buffett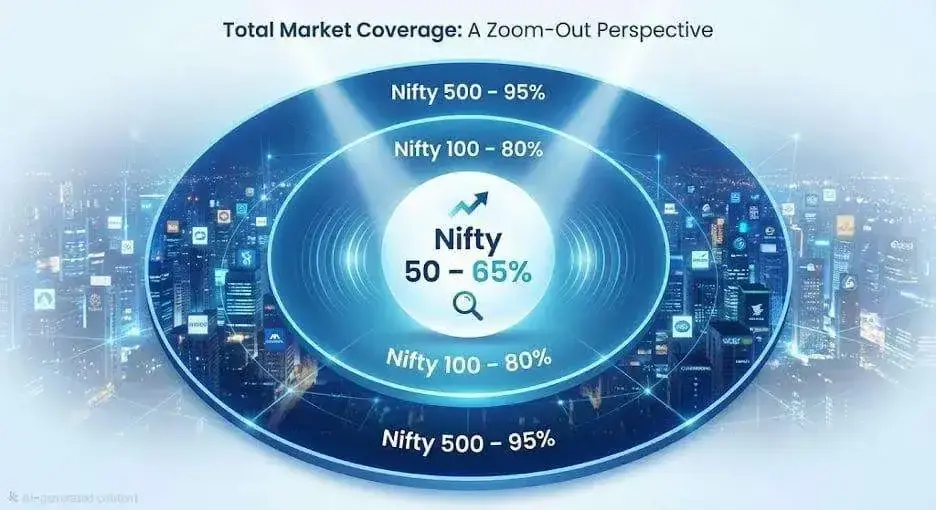
4. Sectoral Indices: Bank Nifty, IT Index, Pharma, Auto — Understanding Concentration
When a Sector Becomes “The Market”
During sector-specific rallies, that sector’s index becomes the reference point — and investors lose all perspective. The 2020-2021 IT rally is a perfect case study. Nifty IT index rose 90% in 18 months while Nifty 50 rose 50%. Investors in IT stocks thought they were geniuses. They compared their 80% returns to Nifty 50’s 50% and felt validated.But they weren’t beating “the market” — they were IN a sector that happened to rally. The moment IT corrected in 2022, falling 20%, those returns evaporated. Bank Nifty shows another dimension of this problem — it consists of just 12 banking stocks but represents 30-35% of Nifty 50’s weight. This means when banks rally, Nifty rallies. When banks fall, Nifty falls. In 2020, banks fell 40% while IT rose 50%, yet Nifty fell only 10% because other sectors balanced it out.
The great sectoral indices each have a different story of the economy. Bank Nifty is a 12 stock index tracking HDFC bank, ICIC bank, SBI, Kotak, Axis and reflects performance of the banking sector. Nifty IT follows 10 stocks including TCS, Infosys, Wipro, HCL Tech and Tech Mahindra and is representative of the performance of the IT services industry. Nifty Pharma owns 10 stocks such as Sun Pharma, Dr. Reddy, Cipla, Divis labs that deal with pharmaceuticals. Nifty Auto comprises 15 stocks such as Maruti, Tata motors, M and M, Bajaj auto, Hero motorcycles and car and auto part. Nifty FMCG encompasses 15 stocks such as HUL, ITC, Nestle, Britannia of the consumer moving goods. It has others, as well, like Nifty Metal, Nifty Realty, Nifty Energy, Nifty PSU Bank, Nifty Private Bank.
The concentration risk in sectoral indices is something nobody talks about seriously enough. Bank Nifty is just 12 stocks, which means one HDFC Bank down 5% can pull the entire index down 1%. Nifty IT is 10 stocks, and if TCS and Infosys (which together are 45% of the index) fall 3%, the index falls even if the other 8 stocks are completely flat.
Compare this to Nifty 50 which has 50 stocks with better diversification. Even if Reliance falls 5%, it affects the index by only 0.5% because Reliance is about 10% of Nifty. The trap investors fall into is buying sectoral index funds or stocks in one sector thinking they’re “diversified because they own 10 companies.” They’re not diversified at all. Ten companies in the same sector move together. When the sector falls, everything falls together. That’s concentration risk disguised as diversification.
To avoid concentration traps like this, read: Portfolio Diversification – How Many Stocks Should You Hold?
Sectoral indices should be used for tactical bets only — short-to-medium term positions where you believe a specific sector is undervalued or about to rally. If you believe banking is undervalued, buy Bank Nifty exposure. If you think IT will rally, buy Nifty IT. These are tactical bets with a 6-12 month horizon. You can also use sectoral indices for understanding sector rotation by comparing Bank Nifty, Nifty IT, Nifty Pharma, and Nifty Auto performance over 6-12 months. You’ll see money rotating between sectors — when one sector falls, another rises.
This is exactly how active fund managers beat benchmarks. They overweight sectors before they rally and underweight before they fall. But never use sectoral indices for your long-term core portfolio. Don’t bet your retirement on one sectoral index. A decade of underperformance in that sector wipes out your wealth. Core portfolio should always be broad-based indices like Nifty 50 or Nifty 500.
“Wide diversification is only required when investors do not understand what they are doing.”
— Warren Buffett
5. Market Cap Indices: Large, Mid, Small — Understanding Risk vs Return
The Risk Ladder Most Investors Ignore
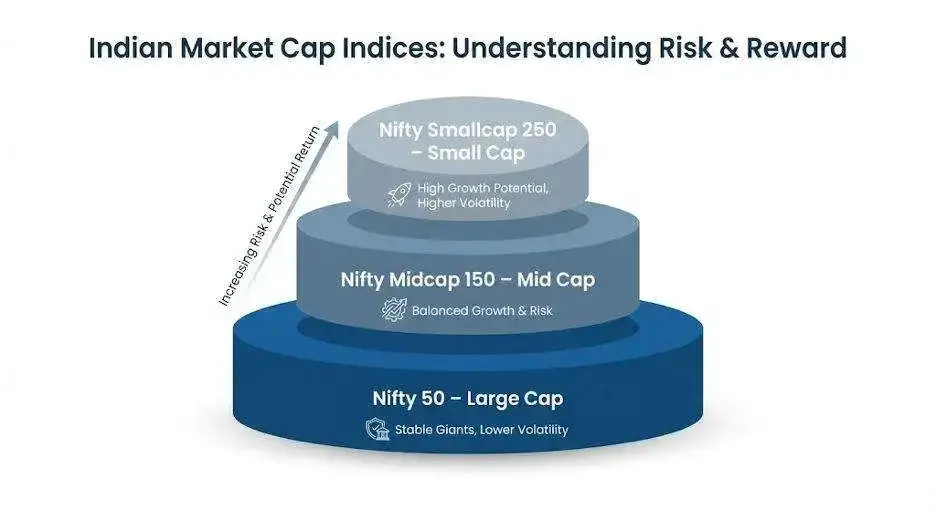
India’s market-cap indices are structured like a risk ladder and the more you climb the greater the potential yield though at the same time a disastrous fall can occur. Nifty 50 is big-cap comprising 50 biggest companies whose market cap (on average) is in range of ₹1.5-2 lakh crore.They are stable, liquid, existing businesses having low growth potentials but low volatility as well. Nifty Next 50 includes those that are ranked 51-100 and yet large-caps but awaiting inclusion into Nifty 50. Nifty Midcap 150 will contain the 101 to 250 ranks of companies having a mean market cap of ₹15,000-50,000 crore high growth potential and highly volatile.
To understand how large, mid, and small-cap classifications actually work, read: What is Market Capitalization? Large, Mid, Small Cap Explained with Examples
Nifty Smallcap 250 follows leading companies of 251-500 range in terms of comparative market capital (average market capital of rupees 2,000-15,000 crore) with the greatest growth potential but highest volatility. The trade-off between returns and risk is well revealed when you compare historic 15-year CAGR. Historically, Nifty 50 has delivered roughly 12% annual returns over long periods.
Nifty Midcap 150 gave returns of 14-15 on an annual basis. Nifty Smallcap 250 produced 15-16% per year returns. However, here is the component that kills most investors the volatility and maximum drawdowns. In the crash in 2008 Nifty 50 maximum drawdown was 50-60%. The maximum drawdown of Nifty Midcap 150 was 60-70%. Nifty Smallcap 250 had drawdown of 70-80 max. It is even more brutal when you consider certain numbers of crashes. In the crash of peak to trough in the year 2008, Nifty 50 decreased by 52, Nifty Midcap decreased by 68 and Nifty Smallcap decreased by 74. In the 2018 correction, Nifty 50 dropped by 5 per cent, Nifty Midcap 100 dropped by 21 per cent and Nifty Smallcap 100 dropped by 31 per cent.
To understand how markets behave during extreme phases, read: Bull Market vs Bear Market – How Investors Should React
The lesson from these numbers is critical but most investors miss it completely. Small-caps give you 3-4% higher returns over decades, which sounds amazing. But you must survive 70-80% drawdowns without selling to capture those returns. Most investors can’t do this.
They buy small-caps during rallies when prices are expensive and everyone is making money. Then when the crash comes and small-caps fall 70%, they panic and sell at the bottom. Result — they underperform despite investing in a “higher return” index. This is why understanding your own risk appetite matters more than understanding indices. You can know everything about market cap indices, but if you can’t psychologically handle a 70% drawdown without selling, that knowledge is worthless.
Before choosing mid or small-cap exposure, understand your own tolerance: Understanding Risk vs. Reward: How to Gauge Your Risk Appetite
For young investors with 10+ year horizons, the right allocation is core position in Nifty 50 at 60%, with 20% in Nifty Midcap 150 and 20% in Nifty Smallcap 250. This captures the entire market’s growth while staying diversified across market caps.
Their recommendation is 8020 proportions of Nifty 50 1020 of Nifty Next 50 or Midcap 150 and no small-cap stocks at all because of the 40% pullbacks. The rebalancing discipline is what makes this strategy work long-term. If small-caps rally 50% in a year like they did in 2017, you rebalance by selling some small-cap exposure and buying large-caps. This forces you to sell high and buy low systematically, removing emotion from the decision.
For a structured approach to allocation across assets and market caps, read: Asset Allocation 101: The Key to Reducing Risk and Smoothing Returns
“The intelligent investor is a realist who sells to optimists and buys from pessimists.”—Benjamin Graham
6. Equal-Weight vs Market-Cap-Weight: The Hidden Performance Driver
The Weighting Method That Changes Everything
Most stock market indices are based on market value. That simply means bigger companies have more power in moving the index. In the Nifty 50, a giant company like Reliance influences the index far more than a smaller company. If Reliance moves sharply, the index feels it strongly. Smaller companies barely make a difference.
Equal-weight indices work differently. Here, every stock gets the same importance, whether it’s big or small. In an equal-weight Nifty 50, each company gets 2% weight. So Reliance matters just as much as the smallest company. This spreads influence evenly across all stocks.
Because of this difference, performance can change a lot depending on market conditions. If only a few large stocks are rising while others are flat, the regular Nifty 50 may still show strong returns. But the equal-weight version won’t rise as much because all stocks are counted equally. It needs broader participation to perform well.
For example, in 2020, a handful of big companies performed very well. That helped the regular Nifty 50 more than the equal-weight version. But in 2017, when most stocks were rising together, the equal-weight index did better. It benefited because every stock contributed equally to the rally.
Equal-weight indices offer better diversification since no single stock dominates. They also automatically rebalance by trimming winners and adding to laggards. However, they involve more buying and selling, which increases costs. They can also lag when only a few big stocks are driving the market.
For most investors, the regular market-cap Nifty 50 works perfectly fine. Equal-weight is better for those who want wider exposure and are comfortable with short-term differences in performance. Over long periods, both tend to deliver similar results. The journey, however, can feel very different.
“In investing, what is comfortable is rarely profitable. And popular weighting methods aren’t always optimal.”— Robert Arnott
7. How Fund Managers “Beat the Index” (And Why Most Don’t)
The Benchmark Game
When a mutual fund says, “We beat the benchmark,” it simply means they earned more than a specific index. But here’s the important part — the fund decides which index to compare itself with. Large-cap funds compare with Nifty 50 or Nifty 100. Mid-cap funds use Midcap 150. Small-cap funds use Smallcap 250. So the comparison depends a lot on which race they choose to run.The real twist is this — the benchmark stays fixed, but the fund manager has some flexibility. If mid-cap stocks are rising fast, a fund may increase mid-cap exposure and easily beat a large-cap benchmark. Later, if mid-caps fall, they may shift back. On paper, the yearly return might still look fine, even if the journey was risky.
Over long periods, most active funds struggle to consistently beat their benchmark. One big reason is fees. Active funds charge around 1.5–2% every year, while index funds charge a fraction of that. That difference may look small, but over 10–15 years, it creates a large gap. To justify higher fees, active funds must outperform regularly — and very few do.
Another issue is timing. Fund managers often increase exposure to sectors after they’ve already risen a lot, and reduce exposure when they’re down. This leads to buying high and selling low. Also, many active funds hold almost the same stocks as the index, just in slightly different proportions. So investors end up paying higher fees for returns that look very similar to the index.
There are some fund managers who truly outperform. They usually run focused portfolios with fewer stocks and take clear, high-conviction bets. They think long term and avoid frequent trading. But identifying these managers in advance is difficult. Many investors simply pick last year’s top performer, which doesn’t guarantee future success.
For most retail investors, low-cost index funds are a practical choice. They are simple, transparent, and inexpensive. Active funds can work — but only if the manager consistently adds value. Otherwise, paying higher fees may not be worth it.
“The goal of the non-professional should not be to pick winners but to own a cross-section of businesses that in aggregate are bound to do well.”
— Warren Buffett
Explore our Products
Research Framework

Emerging Titans
Combination of quantitative analysis, industry tailwinds, and management assessment - SPRINT investment philosophy

Tiny Titans
Heavy emphasis on scuttlebutt research, plant visits, and early on-ground signals
FAQs
Should I invest in Nifty 50 or Nifty 500?
+For most investors, Nifty 50 is more than sufficient.. It is liquid, stable and it captures the large-cap performance which a portfolio is all about. Nifty 500 provides exposure to mid and small-caps over and above the large-caps, which provides return potential, but extremely high volatility. In case you can manage 60-70 percent drawdowns during significant crash periods, and you have a truly long-term horizon of 10 and above Nifty 500 is more appropriate in wealth creation. Unless you have the mental capability to deal with such volatility, then sleep better at night and leave Nifty 50.
Why do index funds tracking the same index have different returns?
+The answer is tracking error. Even index funds don’t perfectly replicate the index due to three factors — cash drag from holding some cash for redemptions, rebalancing delays when the index changes composition, and transaction costs from buying and selling stocks. Good index funds have tracking error below 0.2% annually. Bad index funds have 0.5-1% tracking error, which compounds over time into a meaningful difference. Always check the tracking error history before choosing an index fund.
Can I beat Nifty 50 by just investing in Nifty Next 50?
+Sometimes yes, sometimes no — but over the long run, the difference is usually marginal. Nifty Next 50 is not volatile compared to Nifty 50 in the sense that these are a little smaller. Nifty Next 50 is likely to perform good during bull markets. It does not do as well in bear markets. In 10-15 years, the returns are relatively the same as Nifty 50. Most investors do not have it in them to take the marginal additional return considering the increased volatility they must face because of the additional risk you are taking.
Should I invest in equal-weight or market-cap-weight indices?
+For beginners and most investors, market-cap weight (standard Nifty 50) is simpler, more liquid, and works perfectly well. Equal-weight is for investors who deeply understand rebalancing mechanics, want better diversification across all stocks in the index, and don’t mind occasionally underperforming during periods when a few large stocks lead the market. Long-term returns over 15-20 years are fairly similar between the two approaches. Equal-weight outperforms in some decades and underperforms in others. It’s not clearly superior, just different.
Are sectoral index funds a good idea?
+For tactical bets with 6-12 month horizons, yes they can work well if you have a strong view on a specific sector. For your core long-term portfolio, absolutely not. Sectoral indices are far too concentrated with only 10-15 stocks in one sector. One sector can underperform for an entire decade — banks from 2010-2020 or IT from 2000-2010 are perfect examples. If your retirement money is stuck in a sector that underperforms for a decade, the damage can be significant with a retirement corpus. Diversifying your core portfolio is always equitable in diversification of sectors through widest indices such as Nifty 50 or Nifty 500.
What should be the frequency of index performance check?
+Monthly at most, and even that’s probably too frequent for most people. Daily index-watching creates anxiety and leads to bad decisions because short-term volatility tricks your brain into thinking something meaningful has changed when it hasn’t. Check quarterly to see if rebalancing is needed between your equity and debt allocation. Otherwise, ignore the daily and weekly noise completely. The more you check, the worse your decisions tend to be because you’re reacting to meaningless short-term movements.

High growth stock specialist, Value Educator
Shashank Mahajan is an equity research professional with over 12 years of experience in identifying high-potential SME and micro-cap stocks at an early stage. He follows a rigorous scuttlebutt research–driven approach, combining on-ground insights with deep financial analysis. Shashank specializes in uncovering under-researched and under-owned companies with strong management quality and long-term growth potential. Through disciplined research and early identification, he focuses on spotting tomorrow’s market leaders before they enter the mainstream investor radar.

Zen Technologies: Revenue Fell After a Big Win




PNG Jewellers: A 194-Year-Old Name Goes National

Explore our Products
Research Framework
Emerging Titans
Combination of quantitative analysis, industry tailwinds, and management assessment - SPRINT investment philosophy
Tiny Titans
Heavy emphasis on scuttlebutt research, plant visits, and early on-ground signals


 Orders
 Subscription
 Share with friends


Required Details
₹23999.00
(12 month subscription)
As per SEBI regulations, all users are mandated to complete the KYC that is validated for 1 year. Post payment, you will be redirected to the KYC screen


No comments yet. Be the first to comment!